| << Chapter < Page | Chapter >> Page > |

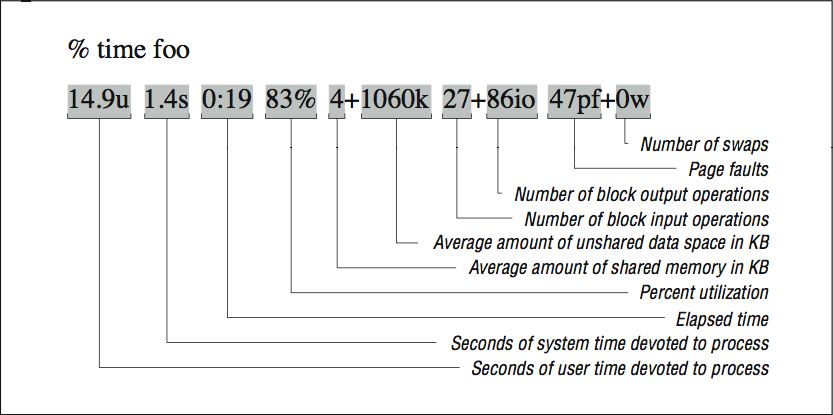
The second average memory utilization measurement,
unshared-memory space , describes the average
real storage dedicated to your program’s data structures as it ran. This storage includes saved local variables and
COMMON for
FORTRAN , and static and external variables for C. We stress the word “real” here and above because these numbers talk about physical memory usage, taken over time. It may be that you have allocated arrays with 1 trillion elements (virtual space), but if your program only crawls into a corner of that space, your runtime memory requirements will be pretty low.
What the unshared-memory space measurement doesn’t tell you, unfortunately, is your program’s demand for memory at its greediest. An application that requires 100 MB 1/10th of the time and 1 KB the rest of the time appears to need only 10 MB on average — not a revealing picture of the program’s memory requirements.
The two figures for blocked I/O operations primarily describe disk usage, though tape devices and some other peripherals may also be used with blocked I/O. Character I/O operations, such as terminal input and output, do not appear here. A large number of blocked I/O operations could explain a lower-than-expected CPU utilization.
An unusually high number of page faults or any swaps probably indicates a system choked for memory, which would also explain a longer-than-expected elapsed time. It may be that other programs are competing for the same space. And don’t forget that even under optimal conditions, every program suffers some number of page faults, as explained in [link] . Techniques for minimizing page faults are described in [link] .
For some benchmarking or tuning efforts, measurements taken on the “outside” of the program tell you everything you need to know. But if you are trying to isolate performance figures for individual loops or portions of the code, you may want to include timing routines on the inside too. The basic technique is simple enough:
If, for instance, X’s primary job is to calculate particle positions, divide by the total time to obtain a number for particle positions/second. You have to be careful though; too many calls to the timing routines, and the observer becomes part of the experiment. The timing routines take time too, and their very presence can increase instruction cache miss or paging. Furthermore, you want X to take a significant amount of time so that the measurements are meaningful. Paying attention to the time between timer calls is really important because the clock used by the timing functions has a limited resolution. An event that occurs within a fraction of a second is hard to measure with any accuracy.
In this section, we discuss methods for getting various timer values during the execution of your program.

Notification Switch
Would you like to follow the 'High performance computing' conversation and receive update notifications?