| << Chapter < Page | Chapter >> Page > |
In the limit of low density (small n ), the a and b terms are negligible, and we have the ideal gas law, as we should for low density. On the other hand, if is small, meaning that the molecules are very close together, the pressure must be higher to give the same nRT , as we would expect in the situation of a highly compressed gas. However, the increase in pressure is less than that argument would suggest, because at high density the term is significant. Since it’s positive, it causes a lower pressure to give the same nRT .
The van der Waals equation of state works well for most gases under a wide variety of conditions. As we’ll see in the next module, it even predicts the gas-liquid transition.
We can examine aspects of the behavior of a substance by plotting a pV diagram , which is a graph of pressure versus volume. When the substance behaves like an ideal gas, the ideal gas law describes the relationship between its pressure and volume. On a pV diagram, it’s common to plot an isotherm , which is a curve showing p as a function of V with the number of molecules and the temperature fixed. Then, for an ideal gas, For example, the volume of the gas decreases as the pressure increases. The resulting graph is a hyperbola.
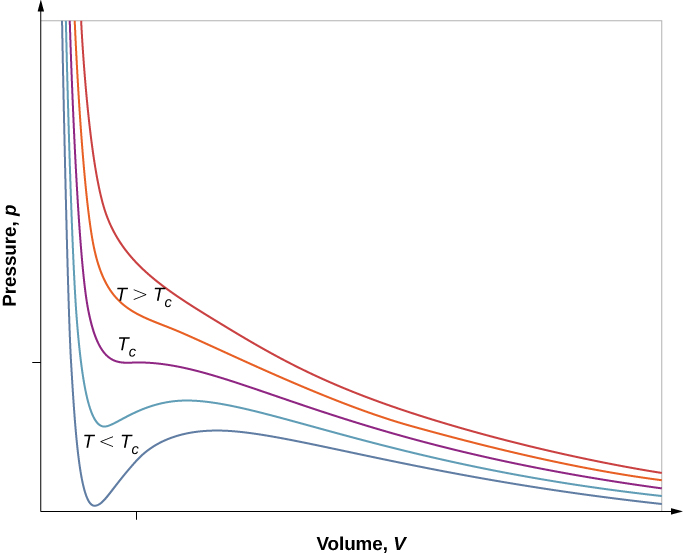
However, if we assume the van der Waals equation of state, the isotherms become more interesting, as shown in [link] . At high temperatures, the curves are approximately hyperbolas, representing approximately ideal behavior at various fixed temperatures. At lower temperatures, the curves look less and less like hyperbolas—that is, the gas is not behaving ideally. There is a critical temperature at which the curve has a point with zero slope. Below that temperature, the curves do not decrease monotonically; instead, they each have a “hump,” meaning that for a certain range of volume, increasing the volume increases the pressure.

Such behavior would be completely unphysical. Instead, the curves are understood as describing a liquid-gas phase transition . The oscillating part of the curve is replaced by a horizontal line, showing that as the volume increases at constant temperature, the pressure stays constant. That behavior corresponds to boiling and condensation; when a substance is at its boiling temperature for a particular pressure, it can increase in volume as some of the liquid turns to gas, or decrease as some of the gas turns to liquid, without any change in temperature or pressure.
[link] shows similar isotherms that are more realistic than those based on the van der Waals equation. The steep parts of the curves to the left of the transition region show the liquid phase, which is almost incompressible—a slight decrease in volume requires a large increase in pressure. The flat parts show the liquid-gas transition; the blue regions that they define represent combinations of pressure and volume where liquid and gas can coexist.

Notification Switch
Would you like to follow the 'University physics volume 2' conversation and receive update notifications?