| << Chapter < Page | Chapter >> Page > |
The line passes through the origin in the x , y -plane. What is the measure of the angle that the line makes with the positive x -axis?
The line passes through the origin in the x , y -plane. What is the measure of the angle that the line makes with the negative x -axis?
0.405 radians
What percentage grade should a road have if the angle of elevation of the road is 4 degrees? (The percentage grade is defined as the change in the altitude of the road over a 100-foot horizontal distance. For example a 5% grade means that the road rises 5 feet for every 100 feet of horizontal distance.)
A 20-foot ladder leans up against the side of a building so that the foot of the ladder is 10 feet from the base of the building. If specifications call for the ladder's angle of elevation to be between 35 and 45 degrees, does the placement of this ladder satisfy safety specifications?
No. The angle the ladder makes with the horizontal is 60 degrees.
Suppose a 15-foot ladder leans against the side of a house so that the angle of elevation of the ladder is 42 degrees. How far is the foot of the ladder from the side of the house?
For the following exercises, graph the functions for two periods and determine the amplitude or stretching factor, period, midline equation, and asymptotes.
amplitude: 3; period:
midline:
no asymptotes
![A graph of two periods of a function with a cosine parent function. The graph has a range of [0,6] graphed over -2pi to 2pi. Maximums as -pi and pi.](/ocw/mirror/col11845_1.2_complete/m49390/CNX_Precalc_Figure_06_03_206.jpg)
amplitude: 3; period:
midline:
no asymptotes
![A graph of four periods of a function with a cosine parent function. Graphed from -4pi to 4pi. Range is [-3,3].](/ocw/mirror/col11845_1.2_complete/m49390/CNX_Precalc_Figure_06_03_208.jpg)
amplitude: 3; period:
midline:
no asymptotes
![A graph of two periods of a sinusoidal function. Range is [-7,-1]. Maximums at -5pi/4 and 3pi/4.](/ocw/mirror/col11845_1.2_complete/m49390/CNX_Precalc_Figure_06_03_210.jpg)
amplitude: 6; period:
midline:
no asymptotes
![A sinusoidal graph over two periods. Range is [-7,5], amplitude is 6, and period is 2pi/3.](/ocw/mirror/col11845_1.2_complete/m49390/CNX_Precalc_Figure_06_03_212.jpg)
For the following exercises, graph the functions for two periods and determine the amplitude or stretching factor, period, midline equation, and asymptotes.
stretching factor: none; period:
midline:
asymptotes:
where
is an integer
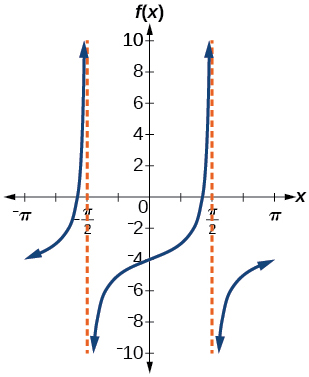
stretching factor: 3; period:
midline:
asymptotes:
where
is an integer
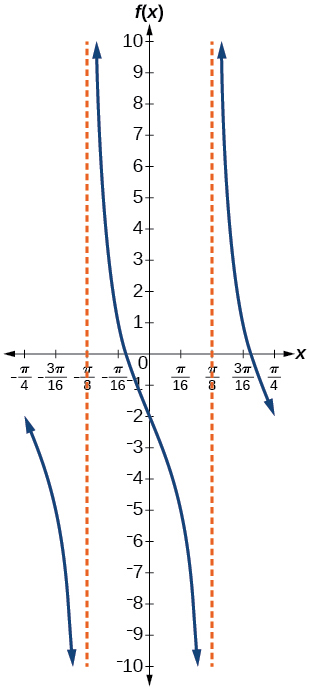
For the following exercises, graph two full periods. Identify the period, the phase shift, the amplitude, and asymptotes.
amplitude: none; period:
no phase shift; asymptotes:
where
is an odd integer
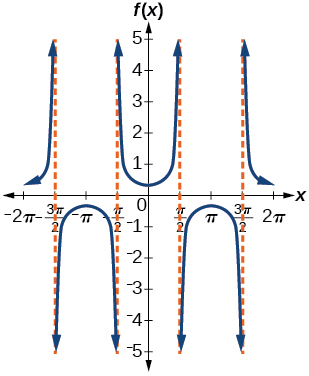
amplitude: none; period:
no phase shift; asymptotes:
where
is an integer
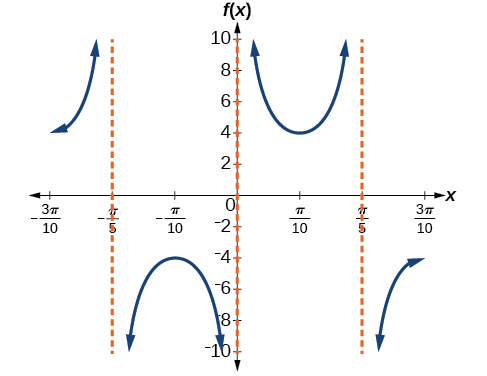
amplitude: none; period:
no phase shift; asymptotes:
where
is an integer
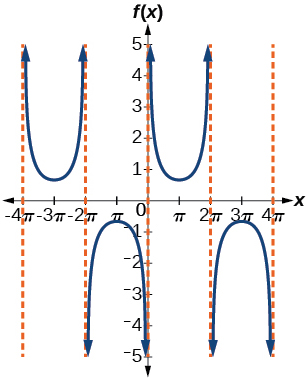
For the following exercises, use this scenario: The population of a city has risen and fallen over a 20-year interval. Its population may be modeled by the following function: where the domain is the years since 1980 and the range is the population of the city.
What is the largest and smallest population the city may have?
largest: 20,000; smallest: 4,000
Graph the function on the domain of .

Notification Switch
Would you like to follow the 'Essential precalculus, part 2' conversation and receive update notifications?