| << Chapter < Page | Chapter >> Page > |

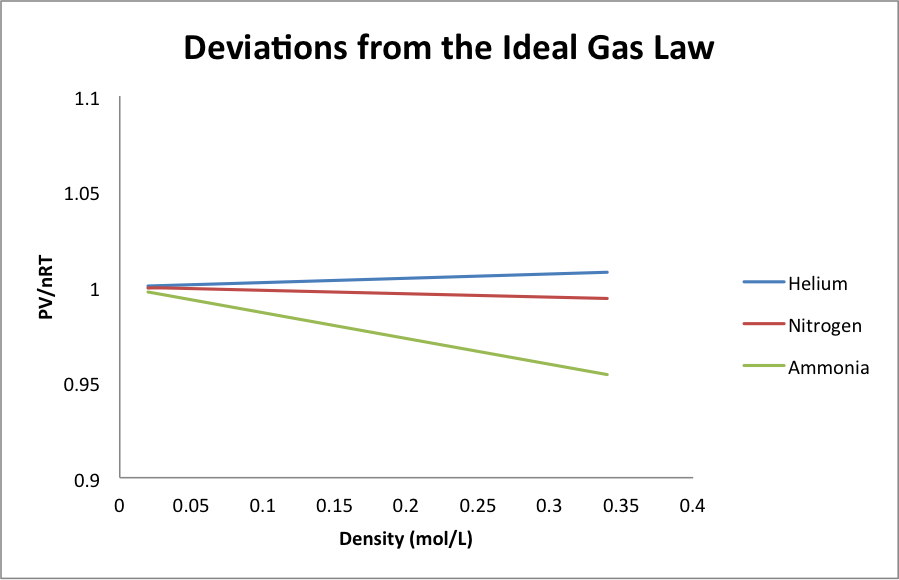
In Figure 2, we can now more easily see that, when the density of the gas gets high enough, the Ideal Gas Law is no longer accurate. In addition, the amount by which the Ideal Gas Law is incorrect, which we might call the “deviation” from the Ideal Gas Law, is different for each gas at high density.
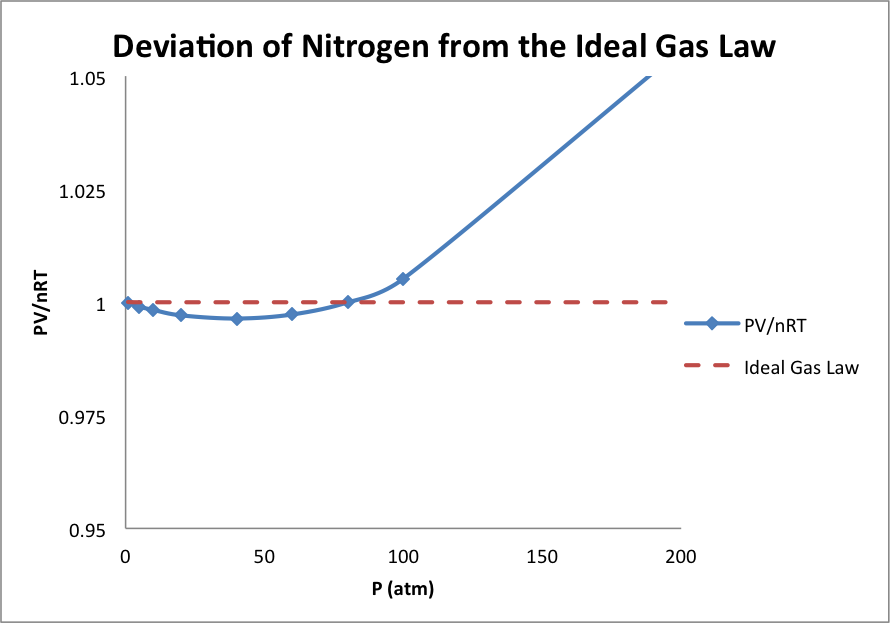
If we push the density of each gas to much higher values, this deviation becomes much greater. This is shown in Figure 3 for N 2 . There are two types of deviation of Figure 3 worth studying. As we start at low density and then increase the density, the value of PV/nRT drops below 1. Note that, just as in Figure 1,the pressure of the gas continues to increase but it increase less than the pressure predicted by the Ideal Gas Law. This is true of most gases and is called “negative deviation” from the Ideal Gas Law, since the pressure is not as great as expected. If we continue to increase the density of the gas, PV/nRT rises about 1, so the pressure of the gas becomes greater than the pressure predicted by the Ideal Gas Law. This is called “positive deviation” from the Ideal Gas Law. The extent of negative deviation or positive deviation is different for different gases, and the pressures at which these deviations occur differ as well, but the graph for N 2 is fairly typical in shape.

We looked at these data to find the limits of the validity of the Ideal Gas Law. From these data, we can definitely conclude that the Ideal Gas Law works quite well provided that the density of the gas n/V is not too high. This is a very valuable conclusion but we need additional data before we can build a model for why this is true.
In Figures 1 and 2, we looked at gas densities where the Ideal Gas Law is accurate. Even at what we might call “high density” in Figures 1 and 2, the density is very low if we compare it to the density of a liquid. In fact, the differences between liquids and gases are enormous. To see this, let’s look at 1.0 g of H 2 O. The volume of 1.0 g of liquid water is very close to 1.0 mL. It varies somewhat with changing temperature, but not very much at all, and even just below the boiling point of water, the volume of 1.0 g of H 2 O is close to 1.0 mL.
Now let’s boil that 1.0 g of liquid H 2 O and let’s figure out what volume the H 2 O gas can fill. From the Ideal Gas Law, we know that the volume is related to the pressure, so let’s take the pressure to be standard pressure, 1 atm. At 100 ↓C and 1 atm pressure, 1.0 g of water gas has a volume of 1700 mL. This means that the same molecules occupy a space which is 1700 times greater when they are in a gas instead of a liquid. This is a very large increase.
How can the molecules occupy so much more space? Perhaps the molecules increase in size by a factor of 1700 when they are gas molecules instead of liquid molecules. But this sounds strange and doesn’t fit other experimental data. The volume of the gas varies with the pressure, so the value 1700 is only valid for a pressure of 1 atm. If we take a lower pressure, the volume increases, and if we take a higher pressure, the volume decreases. It seems unlikely the molecules can change their sizes to fit the pressure. If we try the same changes in pressure for the liquid, we discover that the volume of the liquid changes by such a tiny amount that it is only observable with very careful measurements. If molecules change size with pressure changes, the volume of the liquid should change too. But it does not. We have to conclude that the huge differences in the volumes of a liquid and a gas are not a result of molecules changing size when they evaporate.

Notification Switch
Would you like to follow the 'Concept development studies in chemistry 2013' conversation and receive update notifications?