<< Chapter < Page Chapter >> Page >

Therefore, if a < 0 , then the range is ( - , q ) , meaning that f ( x ) can be any real number less than q . Equivalently, one could write that the range is { y R : y < q } .

For example, the domain of g ( x ) = 3 · 2 x + 1 + 2 is { x : x R } . For the range,

2 x + 1 > 0 3 · 2 x + 1 > 0 3 · 2 x + 1 + 2 > 2

Therefore the range is { g ( x ) : g ( x ) [ 2 , ) } .

Domain and range

  1. Give the domain of y = 3 x .
  2. What is the domain and range of f ( x ) = 2 x ?
  3. Determine the domain and range of y = ( 1 , 5 ) x + 3 .

Intercepts

For functions of the form, y = a b ( x + p ) + q , the intercepts with the x - and y -axis are calculated by setting x = 0 for the y -intercept and by setting y = 0 for the x -intercept.

The y -intercept is calculated as follows:

y = a b ( x + p ) + q y i n t = a b ( 0 + p ) + q = a b p + q

For example, the y -intercept of g ( x ) = 3 · 2 x + 1 + 2 is given by setting x = 0 to get:

y = 3 · 2 x + 1 + 2 y i n t = 3 · 2 0 + 1 + 2 = 3 · 2 1 + 2 = 3 · 2 + 2 = 8

The x -intercepts are calculated by setting y = 0 as follows:

y = a b ( x + p ) + q 0 = a b ( x i n t + p ) + q a b ( x i n t + p ) = - q b ( x i n t + p ) = - q a

Since b > 0 (this is a requirement in the original definition) and a positive number raised to any power is always positive, the last equation above only has a real solution if either a < 0 or q < 0 (but not both). Additionally, a must not be zero for the division to be valid. If these conditions are not satisfied, the graph of the function of the form y = a b ( x + p ) + q does not have any x -intercepts.

For example, the x -intercept of g ( x ) = 3 · 2 x + 1 + 2 is given by setting y = 0 to get:

y = 3 · 2 x + 1 + 2 0 = 3 · 2 x i n t + 1 + 2 - 2 = 3 · 2 x i n t + 1 2 x i n t + 1 = - 2 2

which has no real solution. Therefore, the graph of g ( x ) = 3 · 2 x + 1 + 2 does not have a x -intercept. You will notice that calculating g ( x ) for any value of x will always give a positive number, meaning that y will never be zero and so the graph will never intersect the x -axis.

Intercepts

  1. Give the y-intercept of the graph of y = b x + 2 .
  2. Give the x- and y-intercepts of the graph of y = 1 2 ( 1 , 5 ) x + 3 - 0 , 75 .

Asymptotes

Functions of the form y = a b ( x + p ) + q always have exactly one horizontal asymptote.

When examining the range of these functions, we saw that we always have either y < q or y > q for all input values of x . Therefore the line y = q is an asymptote.

For example, we saw earlier that the range of g ( x ) = 3 · 2 x + 1 + 2 is ( 2 , ) because g ( x ) is always greater than 2. However, the value of g ( x ) can get extremely close to 2, even though it never reaches it. For example, if you calculate g ( - 2 0 ) , the value is approximately 2.000006. Using larger negative values of x will make g ( x ) even closer to 2: the value of g ( - 1 0 0 ) is so close to 2 that the calculator is not precise enough to know the difference, and will (incorrectly) show you that it is equal to exactly 2.

From this we deduce that the line y = 2 is an asymptote.

Asymptotes

  1. Give the equation of the asymptote of the graph of y = 3 x - 2 .
  2. What is the equation of the horizontal asymptote of the graph of y = 3 ( 0 , 8 ) x - 1 - 3 ?

Sketching graphs of the form f ( x ) = a b ( x + p ) + q

In order to sketch graphs of functions of the form, f ( x ) = a b ( x + p ) + q , we need to determine four characteristics:

  1. domain and range
  2. y -intercept
  3. x -intercept

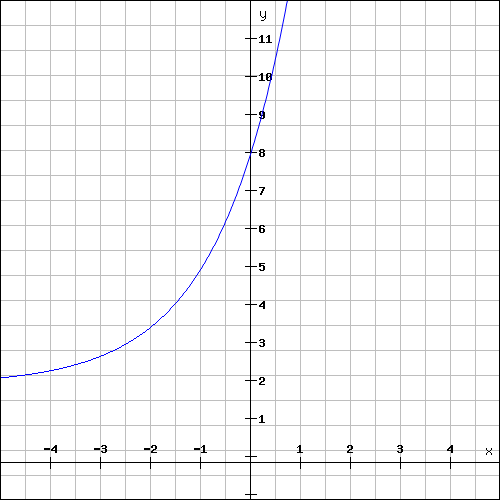
For example, sketch the graph of g ( x ) = 3 · 2 x + 1 + 2 . Mark the intercepts.

We have determined the domain to be { x : x R } and the range to be { g ( x ) : g ( x ) ( 2 , ) } .

The y -intercept is y i n t = 8 and there is no x -intercept.

Graph of g ( x ) = 3 · 2 x + 1 + 2 .

Sketching graphs

  1. Draw the graphs of the following on the same set of axes. Label the horizontal asymptotes and y-intercepts clearly.
    1. y = b x + 2
    2. y = b x + 2
    3. y = 2 b x
    4. y = 2 b x + 2 + 2
    1. Draw the graph of f ( x ) = 3 x .
    2. Explain where a solution of 3 x = 5 can be read off the graph.

End of chapter exercises

  1. The following table of values has columns giving the y -values for the graph y = a x , y = a x + 1 and y = a x + 1 . Match a graph to a column.
    x A B C
    -2 7,25 6,25 2,5
    -1 3,5 2,5 1
    0 2 1 0,4
    1 1,4 0,4 0,16
    2 1,16 0,16 0,064
  2. The graph of f ( x ) = 1 + a . 2 x (a is a constant) passes through the origin.
    1. Determine the value of a .
    2. Determine the value of f ( - 15 ) correct to FIVE decimal places.
    3. Determine the value of x , if P ( x ; 0 , 5 ) lies on the graph of f .
    4. If the graph of f is shifted 2 units to the right to give the function h , write down the equation of h .
  3. The graph of f ( x ) = a . b x ( a 0 ) has the point P(2;144) on f .
    1. If b = 0 , 75 , calculate the value of a .
    2. Hence write down the equation of f .
    3. Determine, correct to TWO decimal places, the value of f ( 13 ) .
    4. Describe the transformation of the curve of f to h if h ( x ) = f ( - x ) .

Get Jobilize Job Search Mobile App in your pocket Now!

Get it on Google Play Download on the App Store Now


Source:  OpenStax, Siyavula textbooks: grade 11 maths. OpenStax CNX. Aug 03, 2011 Download for free at http://cnx.org/content/col11243/1.3
Google Play and the Google Play logo are trademarks of Google Inc.

Notification Switch

Would you like to follow the 'Siyavula textbooks: grade 11 maths' conversation and receive update notifications?

Ask