| << Chapter < Page | Chapter >> Page > |
26 . In a survey of 80 males, 45 had played an organized sport growing up. Of the 70 females surveyed, 25 had played an organized sport growing up. We are interested in whether the proportion for males is higher than the proportion for females. The correct conclusion is that:
27 . From past experience, a statistics teacher has found that the average score on a midterm is 81 with a standard deviation of 5.2. This term, a class of 49 students had a standard deviation of 5 on the midterm. Do the data indicate that we should reject the teacher’s claim that the standard deviation is 5.2? Use α = 0.05.
28 . Three loading machines are being compared. Ten samples were taken for each machine. Machine I took an average of 31 minutes to load packages with a standard deviation of two minutes. Machine II took an average of 28 minutes to load packages with a standard deviation of 1.5 minutes. Machine III took an average of 29 minutes to load packages with a standard deviation of one minute. Find the p -value when testing that the average loading times are the same.
Use the following information to answer the next three exercises: A corporation has offices in different parts of the country. It has gathered the following information concerning the number of bathrooms and the number of employees at seven sites:
| Number of employees x | 650 | 730 | 810 | 900 | 102 | 107 | 1150 |
| Number of bathrooms y | 40 | 50 | 54 | 61 | 82 | 110 | 121 |
29 . Is the correlation between the number of employees and the number of bathrooms significant?
30 . The linear regression equation is:
31 . If a site has 1,150 employees, approximately how many bathrooms should it have?
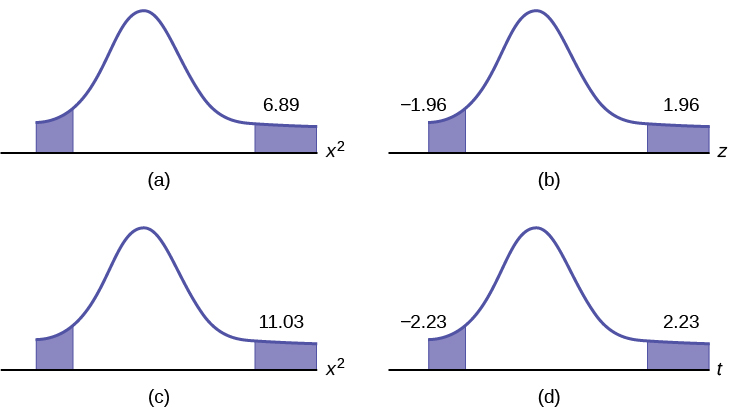
32 . Suppose that a sample of size ten was collected, with = 4.4 and s = 1.4. H 0 : σ 2 = 1.6 vs. H a : σ 2 ≠ 1.6. Which graph best describes the results of the test?

Sixty-four backpackers were asked the number of days since their latest backpacking trip. The number of days is given in [link] :
| # of days | 1 | 2 | 3 | 4 | 5 | 6 | 7 | 8 |
| Frequency | 5 | 9 | 6 | 12 | 7 | 10 | 5 | 10 |
33 . Conduct an appropriate test to determine if the distribution is uniform.
34 . Which of the following statements is true when using one-way ANOVA?
1 . b. parameter.
2 . a.
3 . c. seven
4 . c. 0.02
5 . c. none of the above
6 . d.
7 . a. ≈ 0
8 . b. The values for x are: {1, 2, 3,..., 14}
9 . c. 0.9417.
10 . d. binomial
11 . d. 8.7
12 . a. –1.96
13 . a. 0.6321
14 . d. 360
15 . b.
16 . a.
17 . d.
18 . b. 5.5
19 . d. 6.92
20 . a. 5
21 . b. 0.8541
22 . b. 0.2
23 . a. –1.
24 . c. matched pairs, dependent groups.
25 . d. Reject H 0 . There is sufficient evidence to conclude that there is a difference in the mean scores.
26 . c. there is sufficient evidence to conclude that the proportion for males is higher than the proportion for females.
27 . b. no
28 . b. p -value is close to 1.
29 . b. No
30 . c. = 79.96 x – 0.0094
31 . d. We should not be estimating here.
32 . a.
33 . a. The p -value is>0.10. There is insufficient information to conclude that the distribution is not uniform.
34 . c. The test is to determine if the different groups have the same means.

Notification Switch
Would you like to follow the 'Introductory statistics' conversation and receive update notifications?