<< Chapter < Page Chapter >> Page >

Sketch a graph of f ( x ) = log 3 ( x + 4 ) alongside its parent function. Include the key points and asymptotes on the graph. State the domain, range, and asymptote.
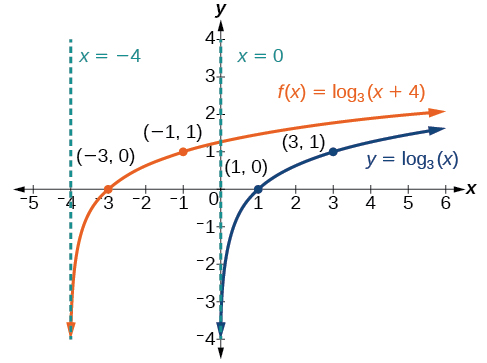
Graph of two functions. The parent function is y=log_3(x), with an asymptote at x=0 and labeled points at (1, 0), and (3, 1).The translation function f(x)=log_3(x+4) has an asymptote at x=-4 and labeled points at (-3, 0) and (-1, 1).

The domain is ( 4 , ) , the range ( , ) , and the asymptote x = 4.

Got questions? Get instant answers now!

Graphing a vertical shift of y = log b ( x )

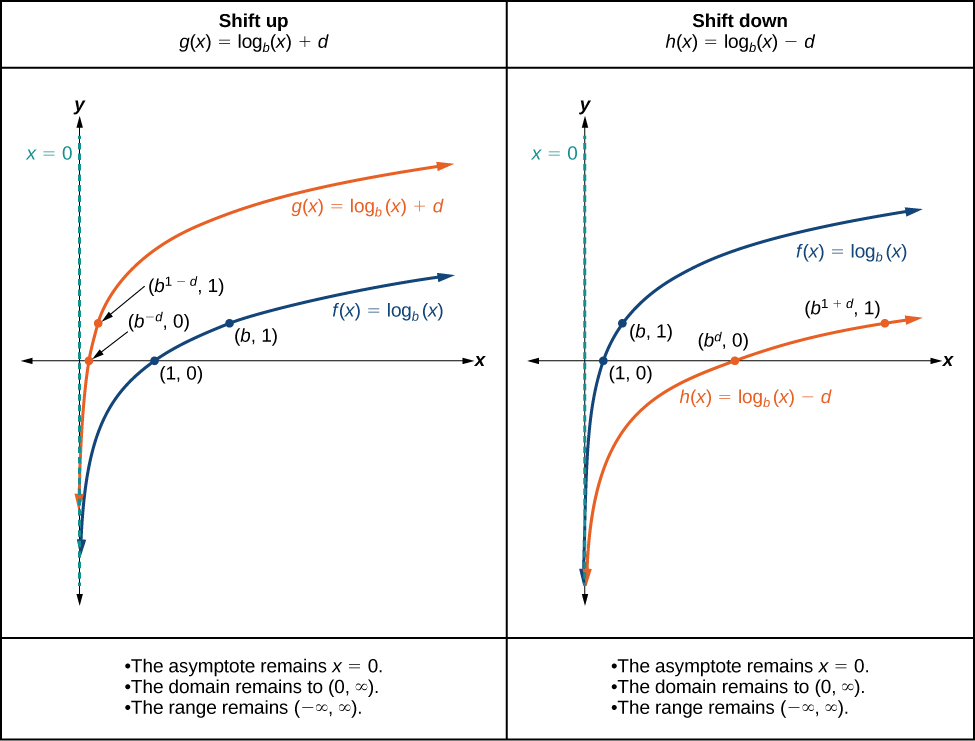
When a constant d is added to the parent function f ( x ) = log b ( x ) , the result is a vertical shift     d units in the direction of the sign on d . To visualize vertical shifts, we can observe the general graph of the parent function f ( x ) = log b ( x ) alongside the shift up, g ( x ) = log b ( x ) + d and the shift down, h ( x ) = log b ( x ) d . See [link] .

Graph of two functions. The parent function is f(x)=log_b(x), with an asymptote at x=0  and g(x)=log_b(x)+d is the translation function with an asymptote at x=0. This shows the translation of shifting up. Graph of two functions. The parent function is f(x)=log_b(x), with an asymptote at x=0  and g(x)=log_b(x)-d is the translation function with an asymptote at x=0. This shows the translation of shifting down.

Vertical shifts of the parent function y = log b ( x )

For any constant d , the function f ( x ) = log b ( x ) + d

  • shifts the parent function y = log b ( x ) up d units if d > 0.
  • shifts the parent function y = log b ( x ) down d units if d < 0.
  • has the vertical asymptote x = 0.
  • has domain ( 0 , ) .
  • has range ( , ) .

Given a logarithmic function with the form f ( x ) = log b ( x ) + d , graph the translation.

  1. Identify the vertical shift:
    • If d > 0 , shift the graph of f ( x ) = log b ( x ) up d units.
    • If d < 0 , shift the graph of f ( x ) = log b ( x ) down d units.
  2. Draw the vertical asymptote x = 0.
  3. Identify three key points from the parent function. Find new coordinates for the shifted functions by adding d to the y coordinate.
  4. Label the three points.
  5. The domain is ( 0, ) , the range is ( , ) , and the vertical asymptote is x = 0.

Graphing a vertical shift of the parent function y = log b ( x )

Sketch a graph of f ( x ) = log 3 ( x ) 2 alongside its parent function. Include the key points and asymptote on the graph. State the domain, range, and asymptote.
Since the function is f ( x ) = log 3 ( x ) 2 , we will notice d = 2. Thus d < 0.

This means we will shift the function f ( x ) = log 3 ( x ) down 2 units.

The vertical asymptote is x = 0.

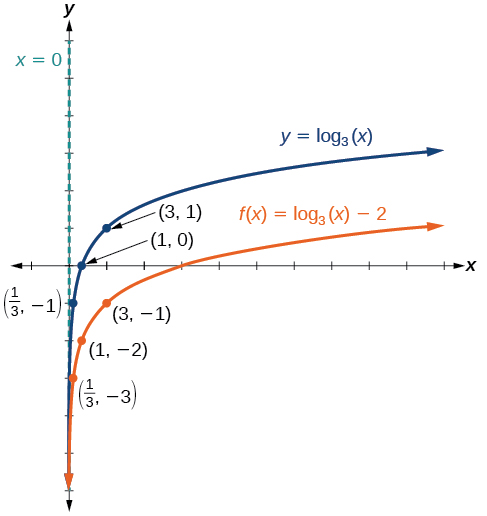
Consider the three key points from the parent function, ( 1 3 , −1 ) , ( 1 , 0 ) , and ( 3 , 1 ) .

The new coordinates are found by subtracting 2 from the y coordinates.

Label the points ( 1 3 , −3 ) , ( 1 , −2 ) , and ( 3 , −1 ) .

The domain is ( 0 , ) , the range is ( , ) , and the vertical asymptote is x = 0.

Graph of two functions. The parent function is y=log_3(x), with an asymptote at x=0 and labeled points at (1/3, -1), (1, 0), and (3, 1).The translation function f(x)=log_3(x)-2 has an asymptote at x=0 and labeled points at (1, 0) and (3, 1).

The domain is ( 0 , ) , the range is ( , ) , and the vertical asymptote is x = 0.

Got questions? Get instant answers now!

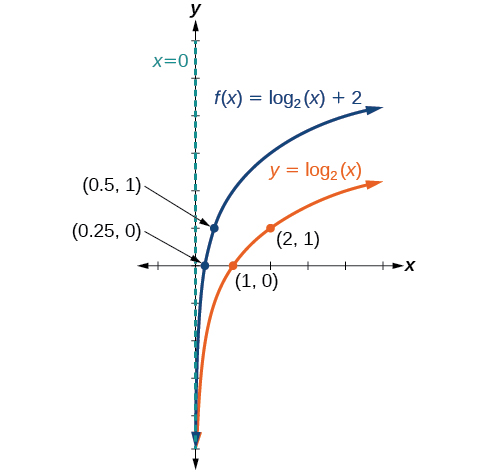
Sketch a graph of f ( x ) = log 2 ( x ) + 2 alongside its parent function. Include the key points and asymptote on the graph. State the domain, range, and asymptote.

Graph of two functions. The parent function is y=log_2(x), with an asymptote at x=0 and labeled points at (1, 0), and (2, 1).The translation function f(x)=log_2(x)+2 has an asymptote at x=0 and labeled points at (0.25, 0) and (0.5, 1).

The domain is ( 0 , ) , the range is ( , ) , and the vertical asymptote is x = 0.

Got questions? Get instant answers now!

Graphing stretches and compressions of y = log b ( x )

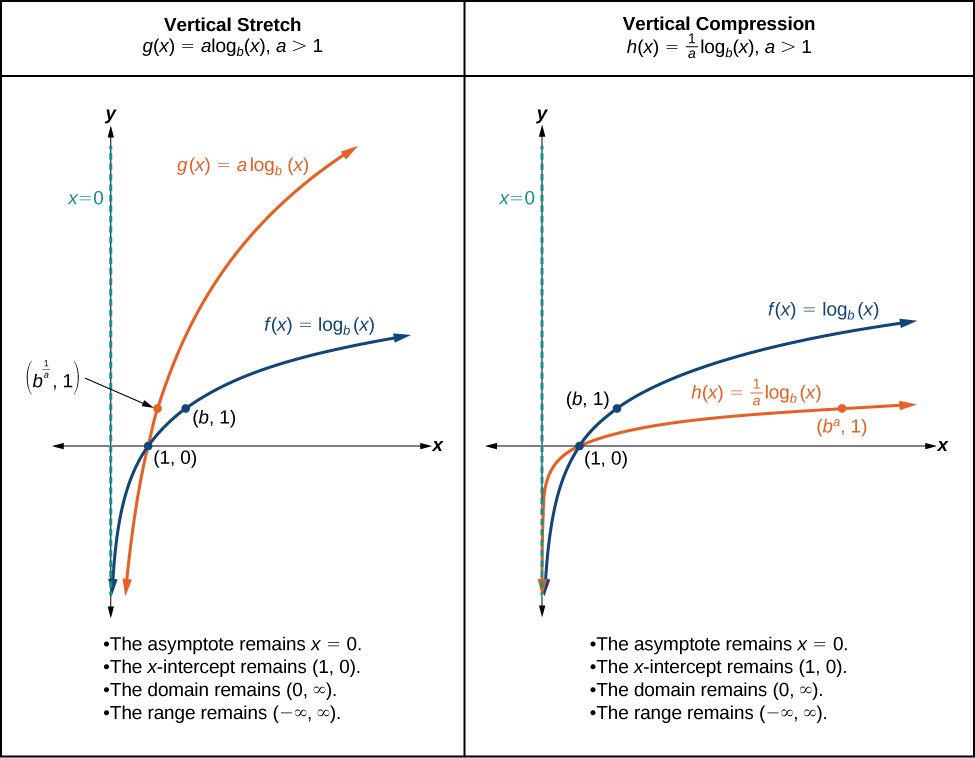
When the parent function f ( x ) = log b ( x ) is multiplied by a constant a > 0 , the result is a vertical stretch    or compression of the original graph. To visualize stretches and compressions, we set a > 1 and observe the general graph of the parent function f ( x ) = log b ( x ) alongside the vertical stretch, g ( x ) = a log b ( x ) and the vertical compression, h ( x ) = 1 a log b ( x ) . See [link] .

Graph of two functions. The parent function is f(x)=log_b(x), with an asymptote at x=0  and g(x)=alog_b(x) when a>1 is the translation function with an asymptote at x=0. The graph note the intersection of the two lines at (1, 0). This shows the translation of a vertical stretch.

Vertical stretches and compressions of the parent function y = log b ( x )

For any constant a > 1 , the function f ( x ) = a log b ( x )

  • stretches the parent function y = log b ( x ) vertically by a factor of a if a > 1.
  • compresses the parent function y = log b ( x ) vertically by a factor of a if 0 < a < 1.
  • has the vertical asymptote x = 0.
  • has the x -intercept ( 1 , 0 ) .
  • has domain ( 0 , ) .
  • has range ( , ) .

Questions & Answers

discuss how the following factors such as predation risk, competition and habitat structure influence animal's foraging behavior in essay form
Burnet Reply
location of cervical vertebra
KENNEDY Reply
What are acid
Sheriff Reply
define biology infour way
Happiness Reply
What are types of cell
Nansoh Reply
how can I get this book
Gatyin Reply
what is lump
Chineye Reply
what is cell
Maluak Reply
what is biology
Maluak
what's cornea?
Majak Reply
what are cell
Achol
Explain the following terms . (1) Abiotic factors in an ecosystem
Nomai Reply
Abiotic factors are non living components of ecosystem.These include physical and chemical elements like temperature,light,water,soil,air quality and oxygen etc
Qasim
Define the term Abiotic
Marial
what is biology
daniel Reply
what is diffusion
Emmanuel Reply
passive process of transport of low-molecular weight material according to its concentration gradient
AI-Robot
what is production?
Catherine
hello
Marial
Pathogens and diseases
how did the oxygen help a human being
Achol Reply
how did the nutrition help the plants
Achol Reply
Got questions? Join the online conversation and get instant answers!
Jobilize.com Reply

Get Jobilize Job Search Mobile App in your pocket Now!

Get it on Google Play Download on the App Store Now


Source:  OpenStax, Precalculus. OpenStax CNX. Jan 19, 2016 Download for free at https://legacy.cnx.org/content/col11667/1.6
Google Play and the Google Play logo are trademarks of Google Inc.

Notification Switch

Would you like to follow the 'Precalculus' conversation and receive update notifications?

Ask