| << Chapter < Page | Chapter >> Page > |
Now that you have learned about the mathematical properties of vectors, we return to vector addition in more detail. There are a number oftechniques of vector addition. These techniques fall into two main categories - graphical and algebraic techniques.
Graphical techniques involve drawing accurate scale diagrams to denote individual vectors and their resultants. We next discuss the two primarygraphical techniques, the head-to-tail technique and the parallelogram method.
In describing the mathematical properties of vectors we used displacements and the head-to-tail graphical method of vector additionas an illustration. The head-to-tail method of graphically adding vectors is a standard method that must be understood.
Method: Head-to-Tail Method of Vector Addition
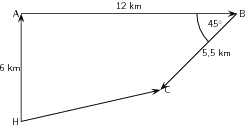
A ship leaves harbour H and sails 6 km north to port A. From here the ship travels 12 km east to port B, before sailing 5,5 km south-west to port C. Determine the ship's resultant displacement using the head-to-tail technique of vector addition.
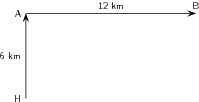
Its easy to understand the problem if we first draw a quick sketch. The rough sketch should include all of the information given in the problem. All of the magnitudes of the displacements are shown and a compass has been included as a reference direction. In a rough sketch one is interested in the approximate shape of the vector diagram.

The choice of scale depends on the actual question – you should choose a scale such that your vector diagram fits the page.
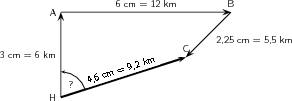
It is clear from the rough sketch that choosing a scale where 1 cm represents 2 km (scale: 1 cm = 2 km) would be a good choice in this problem. The diagram will then take up a good fraction of an A4 page. We now start the accurate construction.
Starting at the harbour H we draw the first vector 3 cm long in the direction north.

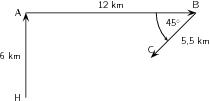
Since the ship is now at port A we draw the second vector 6 cm long starting from point A in the direction east.

Since the ship is now at port B we draw the third vector 2,25 cm long starting from this point in the direction south-west. A protractor is required to measure the angle of 45 .

As a final step we draw the resultant displacement from the starting point (the harbour H) to the end point (port C). We use aruler to measure the length of this arrow and a protractor to determine its direction.

We now use the scale to convert the length of the resultant in the scale diagram to the actual displacement in the problem. Since we have chosen a scale of 1 cm = 2 km in this problem the resultant has a magnitude of 9,2 km. The direction can be specified in terms of the angle measured either as 072,3 east of north or on a bearing of 072,3 .
The resultant displacement of the ship is 9,2 km on a bearing of 072,3 .

Notification Switch
Would you like to follow the 'Siyavula textbooks: grade 11 physical science' conversation and receive update notifications?