| << Chapter < Page | Chapter >> Page > |
In this chapter, you will learn to:
Equations whose graphs are straight lines are called linear equations . The following are some examples of linear equations:
, , , , and .
A line is completely determined by two points, therefore, to graph a linear equation, we need to find the coordinates of two points. This can be accomplished by choosing an arbitrary value for or and then solving for the other variable.
Graph the line:
We need to find the coordinates of at least two points.
We arbitrarily choose , , and .
If , then or . Therefore, (–1, –1) is a point on this line.
If , then or . Hence the point (0, 2).
If , then , and we get the point (1, 5). Below, the results are summarized, and the line is graphed.
| -1 | 0 | 1 | |
| -1 | 2 | 5 |

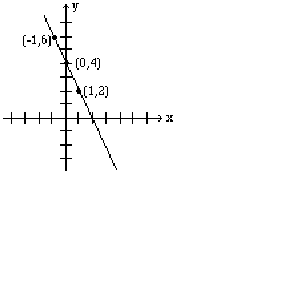
Graph the line:
Again, we need to find coordinates of at least two points.
We arbitrarily choose , and .
If , then which results in . Therefore, (–1, 6) is a point on this line.
If , then , which results in . Hence the point (0, 4).
If , then , which yields , and gives the point (1, 2). The table below shows the points, and the line is graphed.
| -1 | 0 | 1 | |
| 6 | 4 | 2 |

The points at which a line crosses the coordinate axes are called the intercepts . When graphing a line, intercepts are preferred because they are easy to find. In order to find the x-intercept, we let , and to find the y-intercept, we let .
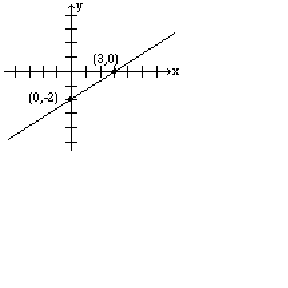
Find the intercepts of the line: , and graph.
To find the x-intercept, we let in our equation, and solve for .
Therefore, the x-intercept is 3.
Similarly by letting , we obtain the y-intercept which is -2.

In higher math, equations of lines are sometimes written in parametric form. For example, , . The letter is called the parameter or the dummy variable. Parametric lines can be graphed by finding values for and by substituting numerical values for .
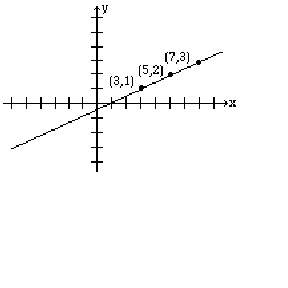
Graph the line given by the parametric equations: ,
Let , 1 and 2, and then for each value of find the corresponding values for and .
The results are given in the table below.
| 0 | 1 | 2 | |
| 3 | 5 | 7 | |
| 1 | 2 | 3 |

When an equation of a line has only one variable, the resulting graph is a horizontal or a vertical line.
The graph of the line , where is a constant, is a vertical line that passes through the point ( , 0). Every point on this line has the x-coordinate , regardless of the y-coordinate.

Notification Switch
Would you like to follow the 'Linear equations' conversation and receive update notifications?