| << Chapter < Page | Chapter >> Page > |
Sometimes you want more detail than the overall timing of the application. But you don’t have time to modify the code to insert several hundred etime calls into your code. Profiles are also very useful when you have been handed a strange 20,000-line application program and told to figure out how it works and then improve its performance.
Most compilers provide a facility to automatically insert timing calls into your code at the entry and exit of each routine at compile time. While your program runs, the entry and exit times are recorded and then dumped into a file. A separate utility summarizes the execution patterns and produces a report that shows the percentage of the time spent in each of your routines and the library routines.
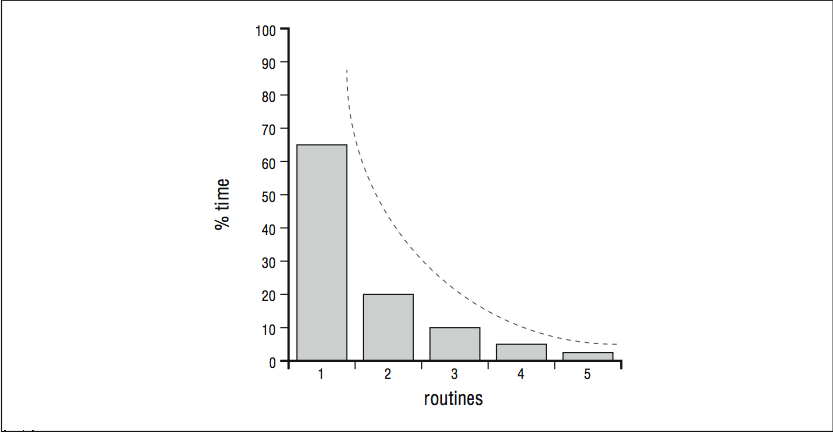
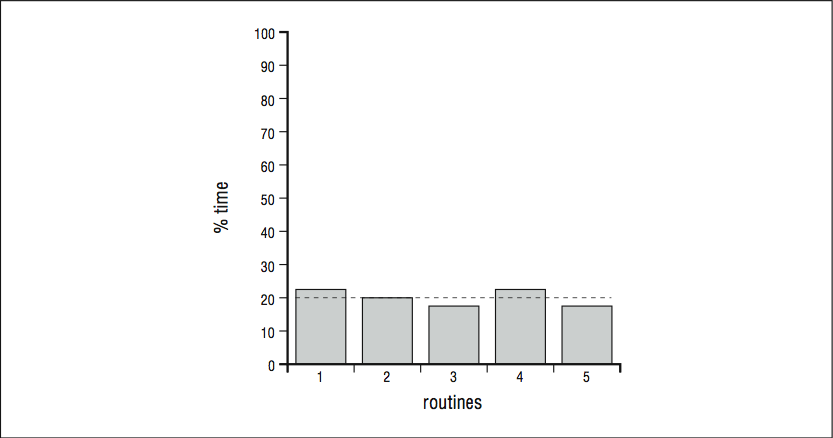
The profile gives you a sense of the shape of the execution profile. That is, you can see that 10% of the time is spent in subroutine A, 5% in subroutine B, etc. Naturally, if you add all of the routines together they should account for 100% of the overall time spent. From these percentages you can construct a picture — a profile — of how execution is distributed when the program runs. Though not representative of any particular profiling tool, the histograms in [link] and [link] depict these percentages, sorted from left to right, with each vertical column representing a different routine. They help illustrate different profile shapes.

A sharp profile says that most of the time is spent in one or two procedures, and if you want to improve the program’s performance you should focus your efforts on tuning those procedures. A minor optimization in a heavily executed line of code can sometimes have a great effect on the overall runtime, given the right opportunity. A flat profile , The term “flat profile” is a little overloaded. We are using it to describe a profile that shows an even distribution of time throughout the program. You will also see the label flat profile used to draw distinction from a call graph profile, as described below. on the other hand, tells you that the runtime is spread across many routines, and effort spent optimizing any one or two will have little benefit in speeding up the program. Of course, there are also programs whose execution profile falls somewhere in the middle.

We cannot predict with absolute certainty what you are likely to find when you profile your programs, but there are some general trends. For instance, engineering and scientific codes built around matrix solutions often exhibit very sharp profiles. The runtime is dominated by the work performed in a handful of routines. To tune the code, you need to focus your efforts on those routines to make them more efficient. It may involve restructuring loops to expose parallelism, providing hints to the compiler, or rearranging memory references. In any case, the challenge is tangible; you can see the problems you have to fix.
There are limits to how much tuning one or two routines will improve your runtime, of course. An often quoted rule of thumb is Amdahl’s Law , derived from remarks made in 1967 by one of the designers of the IBM 360 series, and founder of Amdahl Computer, Gene Amdahl. Strictly speaking, his remarks were about the performance potential of parallel computers, but people have adapted Amdahl’s Law to describe other things too. For our purposes, it goes like this: Say you have a program with two parts, one that can be optimized so that it goes infinitely fast and another that can’t be optimized at all. Even if the optimizable portion makes up 50% of the initial runtime, at best you will be able to cut the total runtime in half. That is, your runtime will eventually be dominated by the portion that can’t be optimized. This puts an upper limit on your expectations when tuning.

Notification Switch
Would you like to follow the 'High performance computing' conversation and receive update notifications?