| << Chapter < Page | Chapter >> Page > |

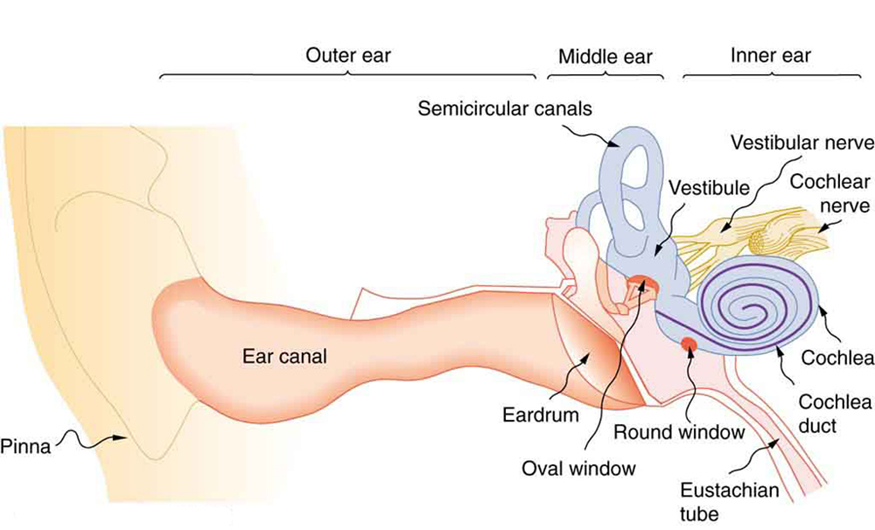
The hearing mechanism involves some interesting physics. The sound wave that impinges upon our ear is a pressure wave. The ear is a transducer that converts sound waves into electrical nerve impulses in a manner much more sophisticated than, but analogous to, a microphone. [link] shows the gross anatomy of the ear with its division into three parts: the outer ear or ear canal; the middle ear, which runs from the eardrum to the cochlea; and the inner ear, which is the cochlea itself. The body part normally referred to as the ear is technically called the pinna.

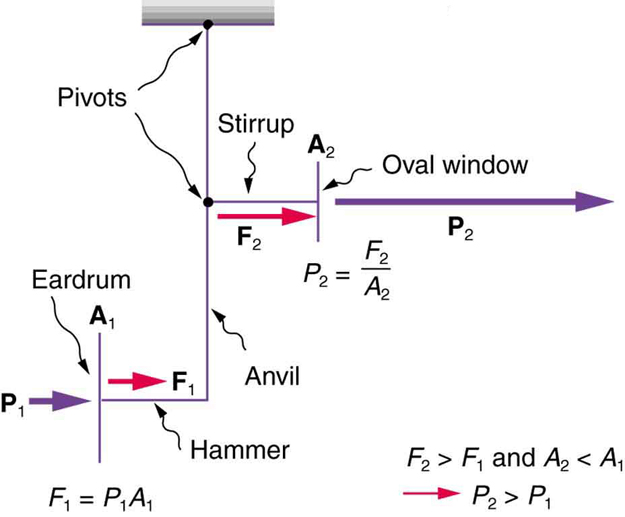
The outer ear, or ear canal, carries sound to the recessed protected eardrum. The air column in the ear canal resonates and is partially responsible for the sensitivity of the ear to sounds in the 2000 to 5000 Hz range. The middle ear converts sound into mechanical vibrations and applies these vibrations to the cochlea. The lever system of the middle ear takes the force exerted on the eardrum by sound pressure variations, amplifies it and transmits it to the inner ear via the oval window, creating pressure waves in the cochlea approximately 40 times greater than those impinging on the eardrum. (See [link] .) Two muscles in the middle ear (not shown) protect the inner ear from very intense sounds. They react to intense sound in a few milliseconds and reduce the force transmitted to the cochlea. This protective reaction can also be triggered by your own voice, so that humming while shooting a gun, for example, can reduce noise damage.

[link] shows the middle and inner ear in greater detail. Pressure waves moving through the cochlea cause the tectorial membrane to vibrate, rubbing cilia (called hair cells), which stimulate nerves that send electrical signals to the brain. The membrane resonates at different positions for different frequencies, with high frequencies stimulating nerves at the near end and low frequencies at the far end. The complete operation of the cochlea is still not understood, but several mechanisms for sending information to the brain are known to be involved. For sounds below about 1000 Hz, the nerves send signals at the same frequency as the sound. For frequencies greater than about 1000 Hz, the nerves signal frequency by position. There is a structure to the cilia, and there are connections between nerve cells that perform signal processing before information is sent to the brain. Intensity information is partly indicated by the number of nerve signals and by volleys of signals. The brain processes the cochlear nerve signals to provide additional information such as source direction (based on time and intensity comparisons of sounds from both ears). Higher-level processing produces many nuances, such as music appreciation.

Notification Switch
Would you like to follow the 'Basic physics for medical imaging' conversation and receive update notifications?