| << Chapter < Page | Chapter >> Page > |

Once again, this is predictable from the rules of exponents:
In the first chapter, we talked about linear functions as functions that add the same amount every time . For instance, models a function that starts at 4; every time you increase by 1, you add 3 to .
Exponential functions are conceptually very analogous: they multiply by the same amount every time . For instance, models a function that starts at 4; every time you increase by 1, you multiply by 3.
Linear functions can go down, as well as up, by having negative slopes : starts at 4 and subtracts 3 every time. Exponential functions can go down, as well as up, by having fractional bases : starts at 4 and divides by 3 every time.
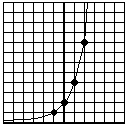
Exponential functions often defy intuition, because they grow much faster than people expect.
Often, the best way to approach this kind of problem is to begin by making a chart, to get a sense of the growth pattern.
| Year | Increase in Value | Value |
|---|---|---|
| 1981 | N/A | 100,000 |
| 1982 | of 100,000 = 8,000 | 108,000 |
| 1983 | of 108,000 = 8,640 | 116,640 |
| 1984 | of 116,640 = 9,331 | 125,971 |
Before you go farther, make sure you understand where the numbers on that chart come from . It’s OK to use a calculator. But if you blindly follow the numbers without understanding the calculations, the whole rest of this section will be lost on you.
In order to find the pattern, look at the “Value” column and ask: what is happening to these numbers every time? Of course, we are adding each time, but what does that really mean? With a little thought—or by looking at the numbers—you should be able to convince yourself that the numbers are multiplying by 1.08 each time . That’s why this is an exponential function: the value of the house multiplies by 1.08 every year.
So let’s make that chart again, in light of this new insight. Note that I can now skip the middle column and go straight to the answer we want. More importantly, note that I am not going to use my calculator this time—I don’t want to multiply all those 1.08s, I just want to note each time that the answer is 1.08 times the previous answer .
| Year | House Value |
|---|---|
| 1981 | 100,000 |
| 1982 | |
| 1983 | |
| 1984 | |
| 1985 | |
If you are not clear where those numbers came from, think again about the conclusion we reached earlier: each year, the value multiplies by 1.08. So if the house is worth in 1983, then its value in 1984 is , which is .
Once we write it this way, the pattern is clear. I have expressed that pattern by adding the last row, the value of the house in any year . And what is the mystery exponent? We see that the exponent is 1 in 1982, 2 in 1983, 3 in 1984, and so on. In the year , the exponent is .
So we have our house value function:
That is the pattern we needed in order to answer the question. So in the year 2001, the value of the house is . Bringing the calculator back, we find that the value of the house is now $466,095 and change.
Wow! The house is over four times its original value! That’s what I mean about exponential functions growing faster than you expect: they start out slow, but given time, they explode. This is also a practical life lesson about the importance of saving money early in life—a lesson that many people don’t realize until it’s too late.

Notification Switch
Would you like to follow the 'Math 1508 (lecture) readings in precalculus' conversation and receive update notifications?