<< Chapter < Page Chapter >> Page >
Linear Regression and Correlation: Outliers is a part of Collaborative Statistics collection (col10522) by Barbara Illowsky and Susan Dean. The module has been modified to include a graphical method for identifying outliers contributed by Roberta Bloom.

In some data sets, there are values (observed data points) called outliers . Outliers are observed data points that are far from the least squares line. They have large "errors", where the "error" or residual is the vertical distance from the line to the point.

Outliers need to be examined closely. Sometimes, for some reason or another, they should not be included in the analysis ofthe data. It is possible that an outlier is a result of erroneous data. Other times, an outlier may hold valuable information about the population under study and should remain included in the data. The key is to carefully examinewhat causes a data point to be an outlier.

Besides outliers, a sample may contain one or a few points that are called influential points . Influential points are observed data points that are far from the other observed data points in the horizontal direction. These points may have a big effect on the slope of the regression line. To begin to identify an influential point, you can remove it from the data set and see if the slope of the regression line is changed significantly.

Computers and many calculators can be used to identify outliers from the data. Computer output for regression analysis will often identify both outliers and influential points so that you can examine them.

Identifying outliers

We could guess at outliers by looking at a graph of the scatterplot and best fit line. However we would like some guideline as to how far away a point needs to be in order to be considered an outlier. As a rough rule of thumb, we can flag any point that is located further than two standard deviations above or below the best fit line as an outlier . The standard deviation used is the standard deviation of the residuals or errors.

We can do this visually in the scatterplot by drawing an extra pair of lines that are two standard deviations above and below the best fit line. Any data points that are outside this extra pair of lines are flagged as potential outliers. Or we can do this numerically by calculating each residual and comparing it to twice the standard deviation. On the TI-83, 83+, or 84+, the graphical approach is easier. The graphical procedure is shown first, followed by the numerical calculations. You would generally only need to use one of these methods.

In the third exam/final exam example , you can determine if there is an outlier or not. If there is an outlier, as an exercise, delete it and fit the remaining data to a new line. For thisexample, the new line ought to fit the remaining data better. This means the SSE should be smaller and the correlation coefficient ought to be closer to 1 or -1.

Graphical identification of outliers

With the TI-83,83+,84+ graphing calculators, it is easy to identify the outlier graphically and visually. If we were to measure the vertical distance from any data point to the corresponding point on the line of best fit and that distance was equal to 2 s or farther, then we would consider the data point to be "too far" from the line of best fit. We need to find and graph the lines that are two standard deviations below and above the regression line. Any points that are outside these two lines are outliers. We will call these lines Y2 and Y3:

As we did with the equation of the regression line and the correlation coefficient, we will use technology to calculate this standard deviation for us. Using the LinRegTTest with this data, scroll down through the output screens to find s=16.412

Line Y2=-173.5+4.83 x -2(16.4) and line Y3=-173.5+4.83 x +2(16.4)

where y ^ =-173.5+4.83x is the line of best fit. Y2 and Y3 have the same slope as the line of best fit.

Graph the scatterplot with the best fit line in equation Y1, then enter the two extra lines as Y2 and Y3 in the "Y="equation editor and press ZOOM 9. You will find that the only data point that is not between lines Y2 and Y3 is the point x=65, y=175. On the calculator screen it is just barely outside these lines. The outlier is the student who had a grade of 65 on the third exam and 175 on the final exam; this point is further than 2 standard deviations away from the best fit line.

Sometimes a point is so close to the lines used to flag outliers on the graph that it is difficult to tell if the point is between or outside the lines. On a computer, enlarging the graph may help; on a small calculator screen, zooming in may make the graph clearer. Note that when the graph does not give a clear enough picture, you can use the numerical comparisons to identify outliers.
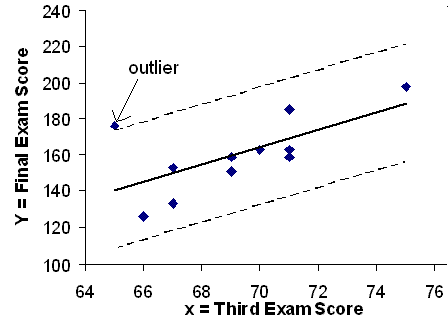
Scatterplot of data and best fit line of the exam score data, showing the lines two standard deviations above and below the best fit line.  The data value (65,175) lies slightly above the upper line identifying it as an outlier.

Numerical identification of outliers

In the table below, the first two columns are the third exam and final exam data. The third column shows the predicted y ^ values calculated from the line of best fit: y ^ =-173.5+4.83 x . The residuals, or errors, have been calculated in the fourth column of the table: observed y value predicted y value = y y ^ .

s is the standard deviation of all the y - y ^ = ε values where n = the total number of data points. If each residual is calculated and squared, and the results are added, we get the SSE. The standard deviation of the residuals is calculated from the SSE as:

s = SSE n - 2

Rather than calculate the value of s ourselves, we can find s using the computer or calculator. For this example, the calculator function LinRegTTest found s = 16.4 as the standard deviation of the residuals

  • 35
  • -17
  • 16
  • -6
  • -19
  • 9
  • 3
  • -1
  • -10
  • -9
  • -1
.

x y y ^ y - y ^
65 175 140 175 - 140 = 35
67 133 150 133 - 150 = -17
71 185 169 185 - 169 = 16
71 163 169 163 - 169 = -6
66 126 145 126 - 145 = -19
75 198 189 198 - 189 = 9
67 153 150 153 - 150 = 3
70 163 164 163 - 164 = -1
71 159 169 159 - 169 = -10
69 151 160 151 - 160 = -9
69 159 160 159 - 160 = -1

We are looking for all data points for which the residual is greater than 2s =2(16.4)=32.8 or less than -32.8. Compare these values to the residuals in column 4 of the table. The only such data point is the student who had a grade of 65 on the third exam and 175 on the final exam; the residual for this student is 35.

How does the outlier affect the best fit line?

Numerically and graphically, we have identified the point (65,175) as an outlier. We should re-examine the data for this point to see if there are any problems with the data. If there is an error we should fix the error if possible, or delete the data. If the data is correct, we would leave it in the data set. For this problem, we will suppose that we examined the data and found that this outlier data was an error. Therefore we will continue on and delete the outlier, so that we can explore how it affects the results, as a learning experience.

Compute a new best-fit line and correlation coefficient using the 10 remaining points:

On the TI-83, TI-83+, TI-84+ calculators, delete the outlier from L1 and L2. Using the LinRegTTest, the new line of best fit and the correlation coefficient are:

y ^ = -355.19 + 7.39x and r = 0.9121

The new line with r = 0.9121 is a stronger correlation than the original ( r =0.6631) because r = 0.9121 is closer to 1. This means that the new line is a better fit to the 10 remaining data values. The line can better predict the final exam score given the third exam score.

Questions & Answers

I'm interested in biological psychology and cognitive psychology
Tanya Reply
what does preconceived mean
sammie Reply
physiological Psychology
Nwosu Reply
How can I develope my cognitive domain
Amanyire Reply
why is communication effective
Dakolo Reply
Communication is effective because it allows individuals to share ideas, thoughts, and information with others.
effective communication can lead to improved outcomes in various settings, including personal relationships, business environments, and educational settings. By communicating effectively, individuals can negotiate effectively, solve problems collaboratively, and work towards common goals.
it starts up serve and return practice/assessments.it helps find voice talking therapy also assessments through relaxed conversation.
miss
Every time someone flushes a toilet in the apartment building, the person begins to jumb back automatically after hearing the flush, before the water temperature changes. Identify the types of learning, if it is classical conditioning identify the NS, UCS, CS and CR. If it is operant conditioning, identify the type of consequence positive reinforcement, negative reinforcement or punishment
Wekolamo Reply
please i need answer
Wekolamo
because it helps many people around the world to understand how to interact with other people and understand them well, for example at work (job).
Manix Reply
Agreed 👍 There are many parts of our brains and behaviors, we really need to get to know. Blessings for everyone and happy Sunday!
ARC
A child is a member of community not society elucidate ?
JESSY Reply
Isn't practices worldwide, be it psychology, be it science. isn't much just a false belief of control over something the mind cannot truly comprehend?
Simon Reply
compare and contrast skinner's perspective on personality development on freud
namakula Reply
Skinner skipped the whole unconscious phenomenon and rather emphasized on classical conditioning
war
explain how nature and nurture affect the development and later the productivity of an individual.
Amesalu Reply
nature is an hereditary factor while nurture is an environmental factor which constitute an individual personality. so if an individual's parent has a deviant behavior and was also brought up in an deviant environment, observation of the behavior and the inborn trait we make the individual deviant.
Samuel
I am taking this course because I am hoping that I could somehow learn more about my chosen field of interest and due to the fact that being a PsyD really ignites my passion as an individual the more I hope to learn about developing and literally explore the complexity of my critical thinking skills
Zyryn Reply
good👍
Jonathan
and having a good philosophy of the world is like a sandwich and a peanut butter 👍
Jonathan
generally amnesi how long yrs memory loss
Kelu Reply
interpersonal relationships
Abdulfatai Reply
What would be the best educational aid(s) for gifted kids/savants?
Heidi Reply
treat them normal, if they want help then give them. that will make everyone happy
Saurabh
Got questions? Join the online conversation and get instant answers!
Jobilize.com Reply
Practice Key Terms 1

Get Jobilize Job Search Mobile App in your pocket Now!

Get it on Google Play Download on the App Store Now


Source:  OpenStax, Quantitative information analysis iii. OpenStax CNX. Dec 25, 2009 Download for free at http://cnx.org/content/col11155/1.1
Google Play and the Google Play logo are trademarks of Google Inc.

Notification Switch

Would you like to follow the 'Quantitative information analysis iii' conversation and receive update notifications?

Ask