| << Chapter < Page | Chapter >> Page > |
Because r is significant and the scatter plot shows a linear trend, the regression line can be used to predict final exam scores.
Suppose you computed the following correlation coefficients. Using the table at the end of the chapter, determine if r is significant and the line of best fit associated with each r can be used to predict a y value. If it helps, draw a number line.
For a given line of best fit, you compute that r = 0 using n = 100 data points. Can the line be used for prediction? Why or why not?
No, the line cannot be used for prediction no matter what the sample size is.
Testing the significance of the correlation coefficient requires that certain assumptions about the data are satisfied. The premise of this test is that the data are a sample of observed points taken from a larger population. We have not examined the entire population because it is not possible or feasible to do so. We are examining the sample to draw a conclusion about whether the linear relationship that we see between x and y in the sample data provides strong enough evidence so that we can conclude that there is a linear relationship between x and y in the population.
The regression line equation that we calculate from the sample data gives the best-fit line for our particular sample. We want to use this best-fit line for the sample as an estimate of the best-fit line for the population. Examining the scatterplot and testing the significance of the correlation coefficient helps us determine if it is appropriate to do this.

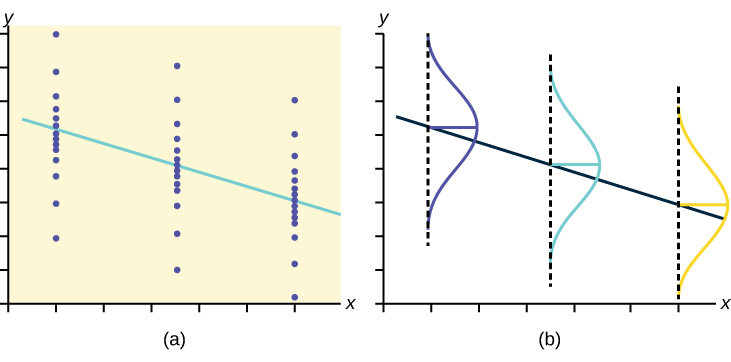
Linear regression is a procedure for fitting a straight line of the form ŷ = a + bx to data. The conditions for regression are:
The slope b and intercept a of the least-squares line estimate the slope β and intercept α of the population (true) regression line. To estimate the population standard deviation of y , σ , use the standard deviation of the residuals, s . . The variable ρ (rho) is the population correlation coefficient. To test the null hypothesis H 0 : ρ = hypothesized value , use a linear regression t-test. The most common null hypothesis is H 0 : ρ = 0 which indicates there is no linear relationship between x and y in the population. The TI-83, 83+, 84, 84+ calculator function LinRegTTest can perform this test (STATS TESTS LinRegTTest).
Least Squares Line or Line of Best Fit:
where
a = y -intercept
b = slope
Standard deviation of the residuals:
where
SSE = sum of squared errors
n = the number of data points
When testing the significance of the correlation coefficient, what is the null hypothesis?
When testing the significance of the correlation coefficient, what is the alternative hypothesis?
H a : ρ ≠ 0
If the level of significance is 0.05 and the p -value is 0.04, what conclusion can you draw?

Notification Switch
Would you like to follow the 'Introductory statistics fall 2014' conversation and receive update notifications?