| << Chapter < Page | Chapter >> Page > |
It’s a Boy Genetics Labs claim their procedures improve the chances of a boy being born. The results for a test of a single population proportion are as follows:
H 0 : p = 0.50, H a : p >0.50
α = 0.01
p -value = 0.025
Interpret the results and state a conclusion in simple, non-technical terms.
Since the p -value is greater than the established alpha value (the p -value is high), we do not reject the null hypothesis. There is not enough evidence to support It’s a Boy Genetics Labs' stated claim that their procedures improve the chances of a boy being born.
When the probability of an event occurring is low, and it happens, it is called a rare event. Rare events are important to consider in hypothesis testing because they can inform your willingness not to reject or to reject a null hypothesis. To test a null hypothesis, find the p -value for the sample data and graph the results. When deciding whether or not to reject the null the hypothesis, keep these two parameters in mind:
When do you reject the null hypothesis?
The probability of winning the grand prize at a particular carnival game is 0.005. Is the outcome of winning very likely or very unlikely?
The outcome of winning is very unlikely.
The probability of winning the grand prize at a particular carnival game is 0.005. Michele wins the grand prize. Is this considered a rare or common event? Why?
It is believed that the mean height of high school students who play basketball on the school team is 73 inches with a standard deviation of 1.8 inches. A random sample of 40 players is chosen. The sample mean was 71 inches, and the sample standard deviation was 1.5 years. Do the data support the claim that the mean height is less than 73 inches? The p -value is almost zero. State the null and alternative hypotheses and interpret the p -value.
H
0 :
μ >= 73
H
a :
μ <73
The
p -value is almost zero, which means there is sufficient data to conclude that the mean height of high school students who play basketball on the school team is less than 73 inches at the 5% level. The data do support the claim.
The mean age of graduate students at a University is at most 31 y ears with a standard deviation of two years. A random sample of 15 graduate students is taken. The sample mean is 32 years and the sample standard deviation is three years. Are the data significant at the 1% level? The p -value is 0.0264. State the null and alternative hypotheses and interpret the p -value.
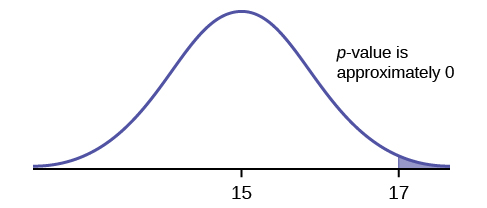
Does the shaded region represent a low or a high p -value compared to a level of significance of 1%?

The shaded region shows a low p -value.
What should you do when α > p -value?
What should you do if α = p -value?
Do not reject H 0 .
If you do not reject the null hypothesis, then it must be true. Is this statement correct? State why or why not in complete sentences.
Use the following information to answer the next seven exercises: Suppose that a recent article stated that the mean time spent in jail by a first-time convicted burglar is 2.5 years. A study was then done to see if the mean time has increased in the new century. A random sample of 26 first-time convicted burglars in a recent year was picked. The mean length of time in jail from the survey was three years with a standard deviation of 1.8 years. Suppose that it is somehow known that the population standard deviation is 1.5. Conduct a hypothesis test to determine if the mean length of jail time has increased. Assume the distribution of the jail times is approximately normal.
Is this a test of means or proportions?
means
What symbol represents the random variable for this test?
In words, define the random variable for this test.
the mean time spent in jail for 26 first time convicted burglars
Is the population standard deviation known and, if so, what is it?
Calculate the following:
Since both σ and are given, which should be used? In one to two complete sentences, explain why.
State the distribution to use for the hypothesis test.
A random survey of 75 death row inmates revealed that the mean length of time on death row is 17.4 years with a standard deviation of 6.3 years. Conduct a hypothesis test to determine if the population mean time on death row could likely be 15 years.

Notification Switch
Would you like to follow the 'Introduction to statistics i - stat 213 - university of calgary - ver2015revb' conversation and receive update notifications?