| << Chapter < Page | Chapter >> Page > |
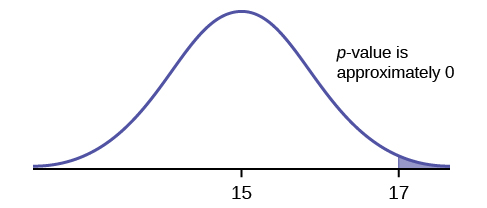
Suppose the null hypothesis is true (the mean height of the loaves is no more than 15 cm). Then is the mean height (17 cm) calculated from the sample unexpectedly large? The hypothesis test works by asking the question how unlikely the sample mean would be if the null hypothesis were true. The graph shows how far out the sample mean is on the normal curve. The p -value is the probability that, if we were to take other samples, any other sample mean would fall at least as far out as 17 cm.
The p -value, then, is the probability that a sample mean is the same or greater than 17 cm. when the population mean is, in fact, 15 cm. We can calculate this probability using the normal distribution for means.

p -value= P ( >17) which is approximately zero.
A p -value of approximately zero tells us that it is highly unlikely that a loaf of bread rises no more than 15 cm, on average. That is, almost 0% of all loaves of bread would be at least as high as 17 cm. purely by CHANCE had the population mean height really been 15 cm. Because the outcome of 17 cm. is so unlikely (meaning it is happening NOT by chance alone) , we conclude that the evidence is strongly against the null hypothesis (the mean height is at most 15 cm.). There is sufficient evidence that the true mean height for the population of the baker's loaves of bread is greater than 15 cm.
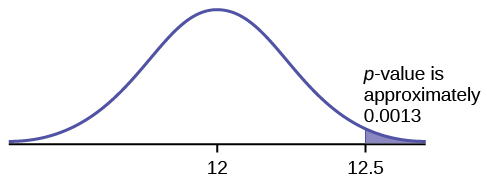
A normal distribution has a standard deviation of 1. We want to verify a claim that the mean is greater than 12. A sample of 36 is taken with a sample mean of 12.5.
H
0 :
μ ≤ 12
H
a :
μ >12
The
p -value is 0.0013
Draw a graph that shows the
p -value.
p -value = 0.0013

A systematic way to make a decision of whether to reject or not reject the null hypothesis is to compare the p -value and a preset or preconceived α (also called a "significance level") . A preset α is the probability of a Type I error (rejecting the null hypothesis when the null hypothesis is true). It may or may not be given to you at the beginning of the problem.
When you make a decision to reject or not reject H 0 , do as follows:
Conclusion: After you make your decision, write a thoughtful conclusion about the hypotheses in terms of the given problem.
When using the p -value to evaluate a hypothesis test, it is sometimes useful to use the following memory device
If the p -value is low, the null must go.
If the p -value is high, the null must fly.
This memory aid relates a p -value less than the established alpha (the p is low) as rejecting the null hypothesis and, likewise, relates a p -value higher than the established alpha (the p is high) as not rejecting the null hypothesis.
Fill in the blanks.
Reject the null hypothesis when ______________________________________.
The results of the sample data _____________________________________.
Do not reject the null when hypothesis when __________________________________________.
The results of the sample data ____________________________________________.
Reject the null hypothesis when the p -value is less than the established alpha value . The results of the sample data support the alternative hypothesis .
Do not reject the null hypothesis when the p -value is greater than the established alpha value . The results of the sample data do not support the alternative hypothesis .

Notification Switch
Would you like to follow the 'Introduction to statistics i - stat 213 - university of calgary - ver2015revb' conversation and receive update notifications?