| << Chapter < Page | Chapter >> Page > |
In Grade 10, you studied graphs of many different forms. In this chapter, you will learn a little more about the graphs of quadratic functions.
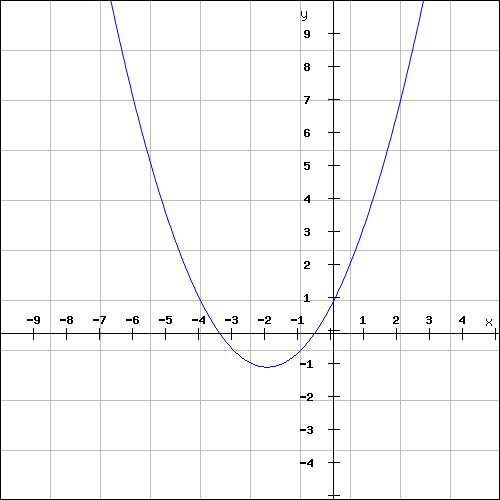
This form of the quadratic function is slightly more complex than the form studied in Grade 10, . The general shape and position of the graph of the function of the form is shown in [link] .

From your graphs, you should have found that affects whether the graph makes a smile or a frown. If , the graph makes a frown and if then the graph makes a smile. This was shown in Grade 10.
You should have also found that the value of affects whether the turning point of the graph is above the -axis ( ) or below the -axis ( ).
You should have also found that the value of affects whether the turning point is to the left of the -axis ( ) or to the right of the -axis ( ).
These different properties are summarised in [link] . The axes of symmetry for each graph is shown as a dashed line.
 |
 |
 |
 | |
 |
 |
 |
 |
Phet simulation for graphing
For , the domain is because there is no value of for which is undefined.
The range of depends on whether the value for is positive or negative. We will consider these two cases separately.
If then we have:
This tells us that for all values of , is always greater than or equal to . Therefore if , the range of is .
Similarly, it can be shown that if that the range of is . This is left as an exercise.
For example, the domain of is because there is no value of for which is undefined. The range of can be calculated as follows:
Therefore the range is .
For functions of the form, , the details of calculating the intercepts with the and axes is given.
The -intercept is calculated as follows:
If , then .
For example, the -intercept of is given by setting to get:

Notification Switch
Would you like to follow the 'Siyavula textbooks: grade 11 maths' conversation and receive update notifications?