| << Chapter < Page | Chapter >> Page > |
The quantum yield of the Group 12-16 semiconductor nanoparticles are affected by many factors such as the following.
Apart from quantum yield information, the relationship between intensity of fluorescence emission and wavelength, other useful qualitative information such as size distribution, shape of the particle and presence of surface defects can be obtained.
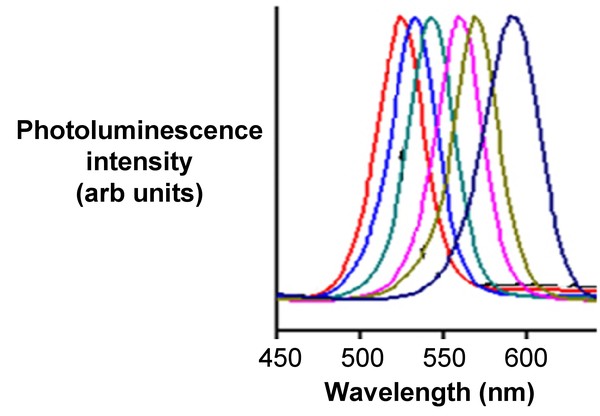
As shown in [link] , the shape of the plot of intensity versus wavelength is a Gaussian distribution. In [link] , the full width at half maximum (FWHM) is given by the difference between the two extreme values of the wavelength at which the photoluminescence intensity is equal to half its maximum value. From the full width half max (FWHM) of the fluorescence intensity Gaussian distribution, it is possible to determine qualitatively the size distribution of the sample. For a Group 12-16 quantum dot sample if the FWHM is greater than 30, the system is very polydisperse and has a large size distribution. It is desirable for all practical applications for the FWHM to be lesser than 30.

From the FWHM of the emission spectra, it is also possible to qualitatively get an idea if the particles are spherical or shaped. During the synthesis of the shaped particles, the thickness of the rod or the arm of the tetrapod does not vary among the different particles, as much as the length of the rods or arms changes. The thickness of the arm or rod is responsible for the quantum effects in shaped particles. In the case of quantum dots, the particle is quantum confined in all dimensions. Thus, any size distribution during the synthesis of quantum dots greatly affects the emission spectra. As a result the FWHM of rods and tetrapods is much smaller as compared to a quantum dot. Hence, qualitatively it is possible to differentiate between quantum dots and other shaped particles.
Another indication of branched structures is the decrease in the intensity of fluorescence peaks. Quantum dots have very high fluorescence values as compared to branched particles, since they are quantum confined in all dimensions as compared to just 1 or 2 dimensions in the case of branched particles.
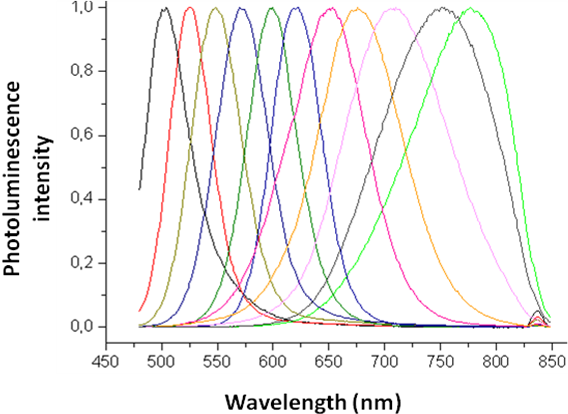
The emission spectra of all Group 12-16 semiconductor nanoparticles are Gaussian curves as shown in [link] and [link] . The only difference between them is the band gap energy, and hence each of the Group 12-16 semiconductor nanoparticles fluoresce over different ranges of wavelengths
Since its bulk band gap (1.74 eV, 712 nm) falls in the visible region cadmium Selenide (CdSe) is used in various applications such as solar cells, light emitting diodes, etc. Size evolving emission spectra of cadmium selenide is shown in [link] . Different sized CdSe particles have different colored fluorescence spectra. Since cadmium and selenide are known carcinogens and being nanoparticles are easily absorbed into the human body, there is some concern regarding these particles. However, CdSe coated with ZnS can overcome all the harmful biological effects, making cadmium selenide nanoparticles one of the most popular 12-16 semiconductor nanoparticle.

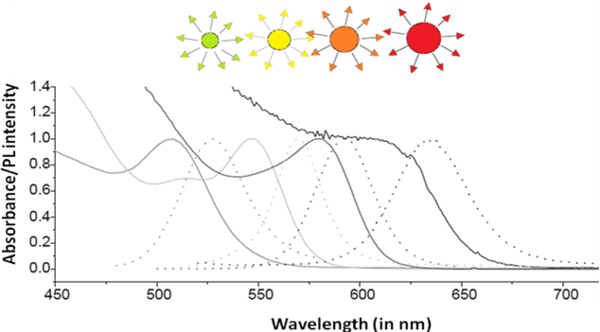
A combination of the absorbance and emission spectra is shown in [link] for four different sized particles emitting green, yellow, orange, and red fluorescence.

Cadmium Telluride (CdTe) has a band gap of 1.44 eV and thus absorbs in the infra red region. The size evolving CdTe emission spectra is shown in [link] .

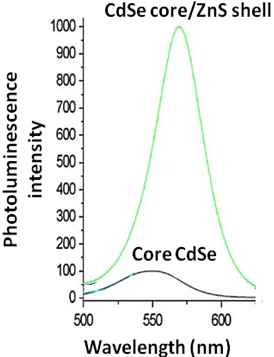
Capping a core quantum dot with a semiconductor material with a wider bandgap than the core, reduces the nonradiative recombination and results in brighter fluorescence emission. Quantum yields are affected by the presences of free surface charges, surface defects and crystal defects, which results in unwanted recombinations. The addition of a shell reduces the nonradiative transitions and majority of the electrons relax radiatively to the valence band. In addition, the shell also overcomes some of the surface defects.
For the CdSe-core/ZnS-shell systems exhibit much higher quantum yield as compared to core CdSe quantum dots as seen in [link] .


Notification Switch
Would you like to follow the 'Nanomaterials and nanotechnology' conversation and receive update notifications?