| << Chapter < Page | Chapter >> Page > |
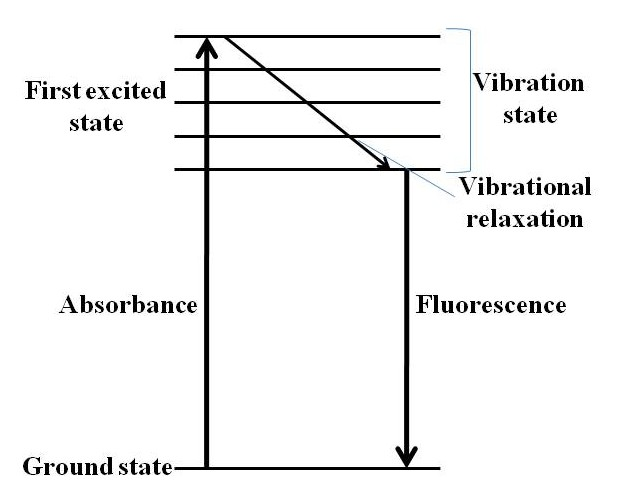
PL spectroscopy can be divided in two different categories: fluorescence and phosphorescence. It is fluorescent PL spectroscopy that is most relevant to QDs. In fluorescent PL spectroscopy, an electron is raised from the ground state to some elevated excited state. The electron than relaxes (loses energy) to the lowest electronic excited state via a non-radiative process. This non-radiative relaxation can occur by a variety of mechanisms, but QDs typically dissipate this energy via vibrational relaxation. This form of relaxation causes vibrations in the material, which effectively heat the QD without emitting light. The electron then decays from the lowest excited state to the ground state with the emission of light. This means that the energy of light absorbed is greater than the energy of the light emitted. The process of fluorescence is schematically summarized in the Jablonski diagram in [link] .

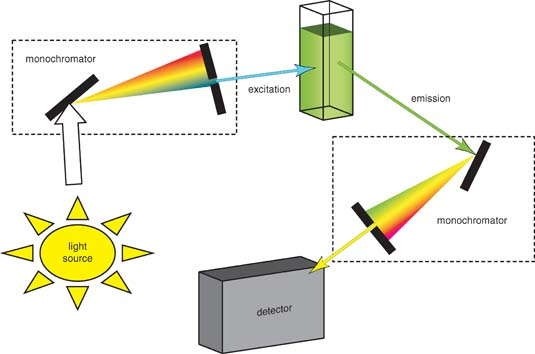
A schematic of a basic design for measuring fluorescence is shown in [link] . The requirements for PL spectroscopy are a source of radiation, a means of selecting a narrow band of radiation, and a detector. Unlike optical absorbance spectroscopy, the detector must not be placed along the axis of the sample, but rather at 90º to the source. This is done to minimize the intensity of transmitted source radiation (light scattered by the sample) reaching the detector. [link] shows two different ways of selecting the appropriate wavelength for excitation: a monochromator and a filter. In a fluorimeter the excitation and emission wavelengths are selected using absorbance or interference filters. In a spectrofluorimeter the excitation and emission wavelengths are selected by a monochromator, see The Application of Fluorescence Spectroscopy in the Mercury Ion Detection .

PL spectra can be recorded in two ways: by measuring the intensity of emitted radiation as a function of the excitation wavelength, or by measuring the emitted radiation as a function of the the emission wavelength. In an excitation spectrum, a fixed wavelength is used to monitor emission while the excitation wavelength is varied. An excitation spectrum is nearly identical to a sample’s absorbance spectrum. In an emission spectrum, a fixed wavelength is used to excite the sample and the intensity of the emitted radiation is monitored as a function of wavelength.
PL spectroscopy data is frequently combined with optical absorbance spectroscopy data to produce a more detailed description of the band gap size of QDs. UV-visible spectroscopy is a specific kind of optical absorbance spectroscopy that measures the transitions from ground state to excited state. This is the opposite of PL spectroscopy, which measures the transitions from excited states to ground states. UV-visible spectroscopy uses light in the visible or ultraviolet range to excite electrons and measures the absorbance of radiation verses wavelength. A sharp peak in the UV-visible spectrum indicates the wavelength at which the sample best absorbs radiation.
As mentioned before, an excitation spectrum is a graph of emission intensity versus excitation wavelength. This spectrum often looks very similar to the absorbance spectrum and in some instances they are the exact same. However, slight differences in the theory behind these techniques do exist. Broadly speaking, an absorption spectrum measures wavelengths at which a molecule absorbs lights, while an excitation spectrum determines the wavelength of light necessary to produce emission or fluorescence from the sample, as monitored at a particular wavelength. It is quite possible then for peaks to appear in the absorbance spectrum that would not occur on the PL excitation spectrum, see Using UV-vis for the detection and characterization of silicon quantum dots .
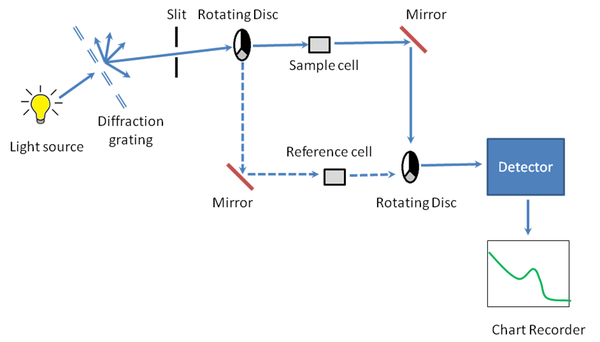
A schematic diagram for a UV-vis spectrometer is shown in [link] . Like PL spectroscopy, the instrument requires a source of radiation, a means of selecting a narrow band of radiation (monochromator), and a detector. Unlike PL spectroscopy, the detector is placed along the same axis as the sample, rather than being directed 90º away from it, see Using UV-vis for the detection and characterization of silicon quantum dots .

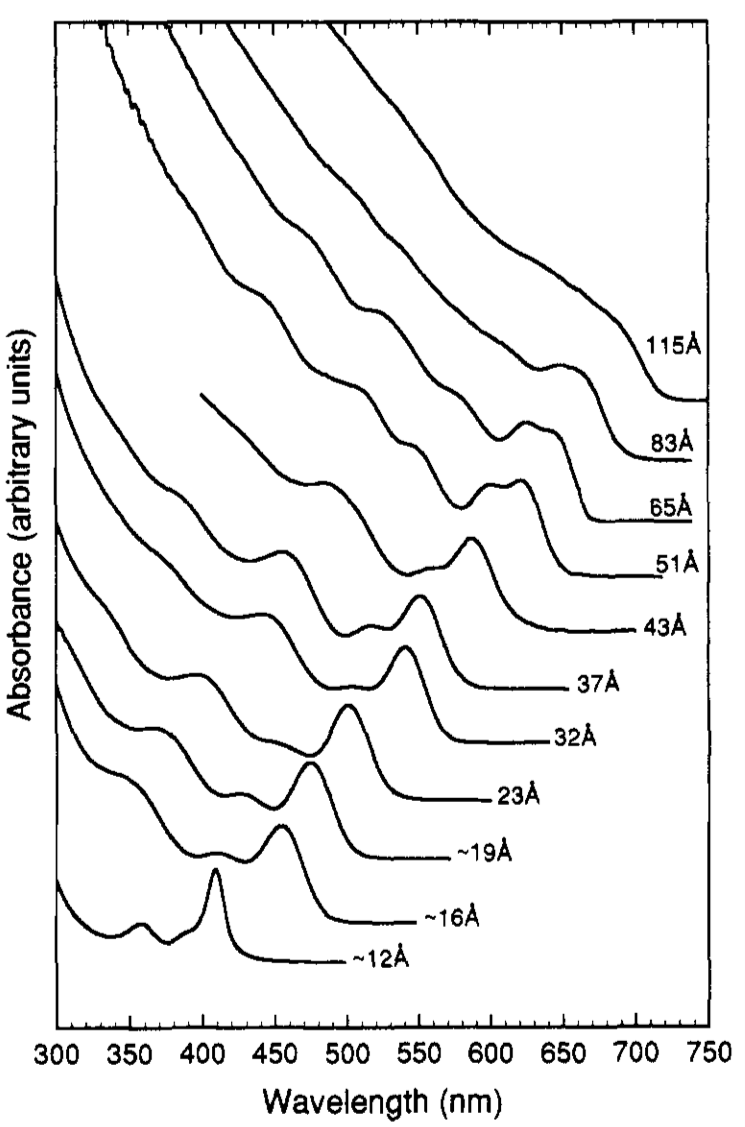
A UV-Vis spectrum, such as the one shown in [link] , can be used not only to determine the band gap of QDs, but to also determine QD size. Because QDs absorb different wavelengths of light based on the size of the particles, UV-Vis (and PL) spectroscopy can provide a convenient and inexpensive way to determine the band gap and/or size of the particle by using the peaks on the spectrum.

The highly tunable nature of QDs, as well as their high extinction coefficient, makes QDs well-suited to a large variety of applications and new technologies. QDs may find use as inorganic fluorophores in biological imaging, as tools to improve efficiency in photovoltaic devices, and even as a implementations for qubits in quantum computers. Knowing the band gap of QDs is essential to understanding how QDs may be used in these technologies. PL and optical absorbance spectroscopies provide ideal ways of obtaining this information, see Using UV-vis for the detection and characterization of silicon quantum dots .

Notification Switch
Would you like to follow the 'Nanomaterials and nanotechnology' conversation and receive update notifications?