<< Chapter < Page Chapter >> Page >

Visit this website for a list of articles and podcasts pertaining to international trade topics.

A numerical example of absolute and comparative advantage

Consider a hypothetical world with two countries, Saudi Arabia and the United States, and two products, oil and corn. Further assume that consumers in both countries desire both these goods. These goods are homogeneous, meaning that consumers/producers cannot differentiate between corn or oil from either country. There is only one resource available in both countries, labor hours. Saudi Arabia can produce oil with fewer resources, while the United States can produce corn with fewer resources. [link] illustrates the advantages of the two countries, expressed in terms of how many hours it takes to produce one unit of each good.

How many hours it takes to produce oil and corn
Country Oil (hours per barrel) Corn (hours per bushel)
Saudi Arabia 1 4
United States 2 1

In [link] , Saudi Arabia has an absolute advantage in the production of oil because it only takes an hour to produce a barrel of oil compared to two hours in the United States. The United States has an absolute advantage in the production of corn.

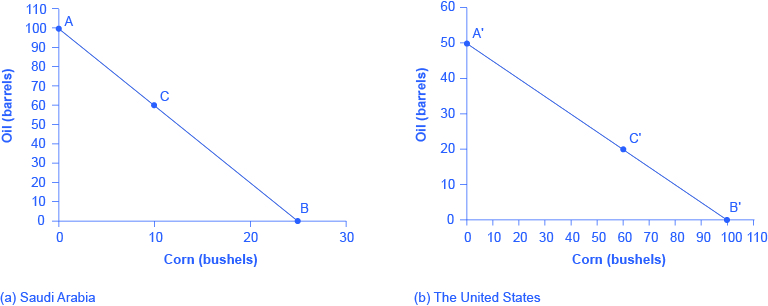
To simplify, let’s say that Saudi Arabia and the United States each have 100 worker hours (see [link] ). We illustrate what each country is capable of producing on its own using a production possibility frontier (PPF) graph, shown in [link] . Recall from Choice in a World of Scarcity that the production possibilities frontier shows the maximum amount that each country can produce given its limited resources, in this case workers, and its level of technology.

Production possibilities before trade
Country Oil Production using 100 worker hours (barrels) Corn Production using 100 worker hours (bushels)
Saudi Arabia 100 or 25
United States 50 or 100

Production possibilities frontiers

These graphs illustrate the production possibilities frontier before trade for both Saudi Arabia and the United States using the data in the table titled “Production Possibilities before Trade”. The x-axis plots corn production, measured by bushels, and the y-axis plots oil, in terms of barrels. All points above the frontier are impossible to produce given the current level of resources and technology.
(a) Saudi Arabia can produce 100 barrels of oil at maximum and zero corn (point A), or 25 bushels of corn and zero oil (point B). It can also produce other combinations of oil and corn if it wants to consume both goods, such as at point C. Here it chooses to produce/consume 60 barrels of oil, leaving 40 work hours that can be allocated to producing 10 bushels of corn, using the data in [link] . (b) If the United States produces only oil, it can produce, at maximum, 50 barrels and zero corn (point A'), or at the other extreme, it can produce a maximum of 100 bushels of corn and no oil (point B'). Other combinations of both oil and corn are possible, such as point C'. All points above the frontiers are impossible to produce given the current level of resources and technology.

Arguably Saudi and U.S. consumers desire both oil and corn to live. Let’s say that before trade occurs, both countries produce and consume at point C or C'. Thus, before trade, the Saudi Arabian economy will devote 60 worker hours to produce oil, as shown in [link] . Given the information in [link] , this choice implies that it produces/consumes 60 barrels of oil. With the remaining 40 worker hours, since it needs four hours to produce a bushel of corn, it can produce only 10 bushels. To be at point C', the U.S. economy devotes 40 worker hours to produce 20 barrels of oil and the remaining worker hours can be allocated to produce 60 bushels of corn.

Questions & Answers

what is decentralised
mithlesh Reply
Ayele, K., 2003. Introductory Economics, 3rd ed., Addis Ababa.
Widad Reply
can you send the book attached ?
Ariel
?
Ariel
What is economics
Widad Reply
the study of how humans make choices under conditions of scarcity
AI-Robot
U(x,y) = (x×y)1/2 find mu of x for y
Desalegn Reply
U(x,y) = (x×y)1/2 find mu of x for y
Desalegn
what is ecnomics
Jan Reply
this is the study of how the society manages it's scarce resources
Belonwu
what is macroeconomic
John Reply
macroeconomic is the branch of economics which studies actions, scale, activities and behaviour of the aggregate economy as a whole.
husaini
etc
husaini
difference between firm and industry
husaini Reply
what's the difference between a firm and an industry
Abdul
firm is the unit which transform inputs to output where as industry contain combination of firms with similar production 😅😅
Abdulraufu
Suppose the demand function that a firm faces shifted from Qd  120 3P to Qd  90  3P and the supply function has shifted from QS  20  2P to QS 10  2P . a) Find the effect of this change on price and quantity. b) Which of the changes in demand and supply is higher?
Toofiq Reply
explain standard reason why economic is a science
innocent Reply
factors influencing supply
Petrus Reply
what is economic.
Milan Reply
scares means__________________ends resources. unlimited
Jan
economics is a science that studies human behaviour as a relationship b/w ends and scares means which have alternative uses
Jan
calculate the profit maximizing for demand and supply
Zarshad Reply
Why qualify 28 supplies
Milan
what are explicit costs
Nomsa Reply
out-of-pocket costs for a firm, for example, payments for wages and salaries, rent, or materials
AI-Robot
concepts of supply in microeconomics
David Reply
economic overview notes
Amahle Reply

Get Jobilize Job Search Mobile App in your pocket Now!

Get it on Google Play Download on the App Store Now


Source:  OpenStax, Microeconomics. OpenStax CNX. Aug 03, 2014 Download for free at http://legacy.cnx.org/content/col11627/1.10
Google Play and the Google Play logo are trademarks of Google Inc.

Notification Switch

Would you like to follow the 'Microeconomics' conversation and receive update notifications?

Ask