| << Chapter < Page | Chapter >> Page > |
In some cases, lawmakers make investments in physical capital as a way of spending money in the districts of key politicians. The result may be unnecessary roads or office buildings. Even if a project is useful and necessary, it might be done in a way that is excessively costly, because local contractors who make campaign contributions to politicians appreciate the extra business. On the other hand, governments sometimes do not make the investments they should because a decision to spend on infrastructure does not need to just make economic sense; it must be politically popular as well. Managing public investment so that it is done in a cost-effective way can be difficult.
If a government decides to finance an investment in public physical capital with higher taxes or lower government spending in other areas, it need not worry that it is directly crowding out private investment. Indirectly however, higher household taxes could cut down on the level of private savings available and have a similar effect. If a government decides to finance an investment in public physical capital by borrowing, it may end up increasing the quantity of public physical capital at the cost of crowding out investment in private physical capital, which is more beneficial to the economy would be dependent on the project being considered.
In most countries, the government plays a large role in society's investment in human capital through the education system. A highly educated and skilled workforce contributes to a higher rate of economic growth. For the low-income nations of the world, additional investment in human capital seems likely to increase productivity and growth. For the United States, tough questions have been raised about how much increases in government spending on education will improve the actual level of education.
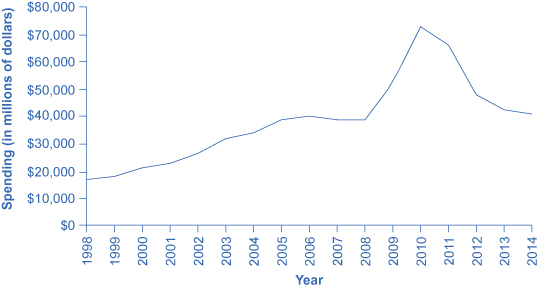
Among economists, discussions of education reform often begin with some uncomfortable facts. As shown in [link] , spending per student for kindergarten through grade 12 (K–12) increased substantially in real dollars through 2010. The U.S. Census Bureau reports that current spending per pupil for elementary and secondary education rose from $5,001 in 1998 to $10,608 in 2012. However, as measured by standardized tests like the SAT, the level of student academic achievement has barely budged in recent decades. Indeed, on international tests, U.S. students lag behind students from many other countries. (Of course, test scores are an imperfect measure of education for a variety of reasons. It would be difficult, however, to argue that there are not real problems in the U.S. education system and that the tests are just inaccurate.)


Notification Switch
Would you like to follow the 'Macroeconomics' conversation and receive update notifications?