<< Chapter < Page Chapter >> Page >
By the end of this section, you will be able to:
  • Explain the poverty trap, noting how it is impacted by government programs
  • Identify potential issues in government programs that seek to reduce poverty
  • Calculate a budget constraint line that represents the poverty trap

Can you give people too much help, or the wrong kind of help? When people are provided with food, shelter, healthcare, income, and other necessities, assistance may reduce their incentive to work. Consider a program to fight poverty that works in this reasonable-sounding manner: the government provides assistance to the poor, but as the poor earn income to support themselves, the government reduces the level of assistance it provides. With such a program, every time a poor person earns $100, the person loses $100 in government support. As a result, the person experiences no net gain for working. Economists call this problem the poverty trap    .

Consider the situation faced by a single-parent family. A single mother (earning $8 an hour) with two children, as illustrated in [link] . First, consider the labor-leisure budget constraint faced by this family in a situation without government assistance. On the horizontal axis is hours of leisure (or time spent with family responsibilities) increasing in quantity from right to left. Also on the horizontal axis is the number of hours at paid work, going from zero hours on the right to the maximum of 2,500 hours on the left. On the vertical axis is the amount of income per year rising from low to higher amounts of income. The budget constraint line shows that at zero hours of leisure and 2,500 hours of work, the maximum amount of income is $20,000 ($8 × 2,500 hours). At the other extreme of the budget constraint line, an individual would work zero hours, earn zero income, but enjoy 2,500 hours of leisure. At point A on the budget constraint line    , by working 40 hours a week, 50 weeks a year, the utility-maximizing choice is to work a total of 2,000 hours per year and earn $16,000.

Now suppose that a government antipoverty program guarantees every family with a single mother and two children $18,000 in income. This is represented on the graph by a horizontal line at $18,000. With this program, each time the mother earns $1,000, the government will deduct $1,000 of its support. [link] shows what will happen at each combination of work and government support.
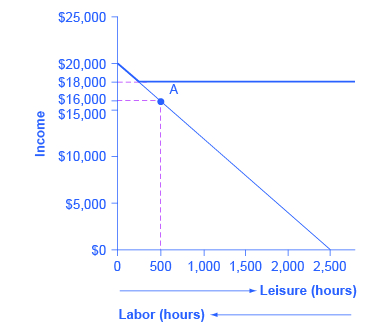
The poverty trap in action

The graph shows a downward sloping line that begins at $20,000 on the y-axis and ends at 2,500 on the x-axis. A horizontal line extends from $18,000 on the y-axis. A dashed plum line extends from $16,000 on the y-axis and intersects with the vertical line extending from 500 on the x-axis at point A. Beneath the x-axis is an arrow pointing to the right indicating leisure (hours) and an arrow pointing to the left indicating labor (hours).
The original choice is 500 hours of leisure, 2,000 hours of work at point A, and income of $16,000. With a guaranteed income of $18,000, this family would receive $18,000 whether it provides zero hours of work or 2,000 hours of work. Only if the family provides, say, 2,300 hours of work does its income rise above the guaranteed level of $18,000—and even then, the marginal gain to income from working many hours is small.
Total income at various combinations of work and support
Amount Worked (hours) Total Earnings Government Support Total Income
0 0 $18,000 $18,000
500 $4,000 $14,000 $18,000
1,000 $8,000 $10,000 $18,000
1,500 $12,000 $6,000 $18,000
2,000 $16,000 $2,000 $18,000
2,500 $20,000 0 $20,000

Questions & Answers

why we learn economics ? Explain briefly
ayalew Reply
why we learn economics ?
ayalew
why we learn economics
ayalew
profit maximize for monopolistically?
Usman Reply
what kind of demand curve under monopoly?
Mik Reply
what is the difference between inflation and scarcity ?
Abdu Reply
What stops oligopolists from acting together as a monopolist and earning the highest possible level of profits?
Mik
why economics is difficult for 2nd school students.
Siraj Reply
what does mean opportunity cost?
Aster Reply
what is poetive effect of population growth
Solomon Reply
what is inflation
Nasir Reply
what is demand
Eleni
what is economics
IMLAN Reply
economics theory describes individual behavior as the result of a process of optimization under constraints the objective to be reached being determined by
Kalkidan
Economics is a branch of social science that deal with How to wise use of resource ,s
Kassie
need
WARKISA
Economic Needs: In economics, needs are goods or services that are necessary for maintaining a certain standard of living. This includes things like healthcare, education, and transportation.
Kalkidan
What is demand and supply
EMPEROR Reply
deman means?
Alex
what is supply?
Alex
ex play supply?
Alex
Money market is a branch or segment of financial market where short-term debt instruments are traded upon. The instruments in this market includes Treasury bills, Bonds, Commercial Papers, Call money among other.
murana Reply
good
Kayode
what is money market
umar Reply
Examine the distinction between theory of comparative cost Advantage and theory of factor proportion
Fatima Reply
What is inflation
Bright Reply
a general and ongoing rise in the level of prices in an economy
AI-Robot
What are the factors that affect demand for a commodity
Florence Reply
price
Kenu

Get Jobilize Job Search Mobile App in your pocket Now!

Get it on Google Play Download on the App Store Now


Source:  OpenStax, Principles of economics. OpenStax CNX. Sep 19, 2014 Download for free at http://legacy.cnx.org/content/col11613/1.11
Google Play and the Google Play logo are trademarks of Google Inc.

Notification Switch

Would you like to follow the 'Principles of economics' conversation and receive update notifications?

Ask