<< Chapter < Page Chapter >> Page >

Outcome

An outcome of an experiment is a single result of that experiment.

  • A possible outcome of Experiment 1: the value on the top face is '3'
  • A possible outcome of Experiment 2: the total value on the top faces is '9'

Sample space

The sample space of an experiment is the complete set of possible outcomes of the experiment.

  • Experiment 1: the sample space is 1,2,3,4,5,6
  • Experiment 2: the sample space is 2,3,4,5,6,7,8,9,10,11,12

Interesting fact

If you roll two die and add the results, the most common outcome is 7. To understand this, think that there is only one way to get 2 as a result (both dice landing with 1) and there is only way to get 12 as a result (both dice landing with 6). The opposite sides of a six sided dice add up to 7. From this you should be able to work out that there are 12 ways to get a 7.

Event

An event is any set of outcomes of an experiment.

  • A possible event of Experiment 1: an even number being on the top face of the die
  • A possible event of Experiment 2: the numbers on the top face of each die being equal

Random experiments

The term random experiment or statistical experiment is used to describe any repeatable process, the results of which are analyzed in some way. For example, flipping a coin and noting whetheror not it lands heads-up is a random experiment because the process is repeatable. On the other hand, your reading this sentence for the first time andnoting whether you understand it is not a random experiment because it is not repeatable (though making a number of random people read it and noting whichones understand it would turn it into a random experiment).

Venn diagrams

A Venn diagram can be used to show the relationship between the possible outcomes of a random experiment and thesample space. The Venn diagram in [link] shows the difference between the universal set, a sample space and events and outcomes as subsets ofthe sample space.
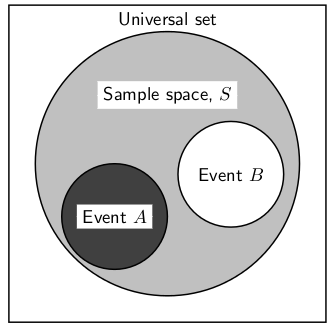
Diagram to show difference between the universal set and the sample space. The sample space is made up of all possible outcomes of astatistical experiment and an event is a subset of the sample space.

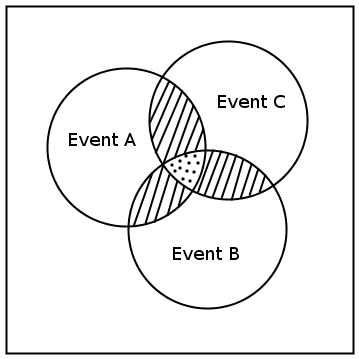
We can draw Venn diagrams for experiments with two and three events. These are shown in [link] and [link] . Venn diagrams for experiments with more than three events are more complex and are not covered at this level.
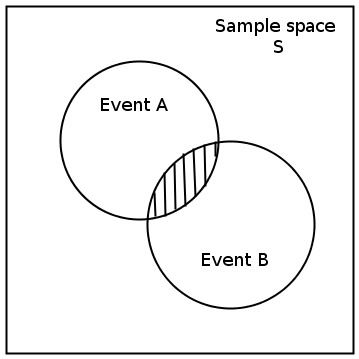
Venn diagram for an experiment with two events
Venn diagram for an experiment with three events.

Interesting fact

The Greek, Russian and Latin alphabets can be illustrated using Venn diagrams. All these alphabets have some common letters. The Venn diagram is given below:

The union of A and B is the set of all elements in A or in B (or in both). A or B is also written A B . The intersection of A and B is the set of all elements in both A and B . A and B is also written as A B .

Venn diagrams can also be used to indicate the union and intersection between events in a sample space ( [link] and [link] ).

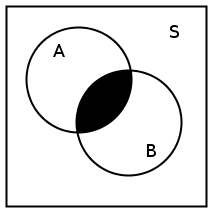
Venn diagram to show (left) union of two events, A and B , in the sample space S .
Venn diagram to show intersection of two events A and B , in the sample space S . The black region indicates the intersection.

Get Jobilize Job Search Mobile App in your pocket Now!

Get it on Google Play Download on the App Store Now


Source:  OpenStax, Siyavula textbooks: grade 10 maths [caps]. OpenStax CNX. Aug 03, 2011 Download for free at http://cnx.org/content/col11306/1.4
Google Play and the Google Play logo are trademarks of Google Inc.

Notification Switch

Would you like to follow the 'Siyavula textbooks: grade 10 maths [caps]' conversation and receive update notifications?

Ask