| << Chapter < Page | Chapter >> Page > |
fft() function
to compute the DFTs.Now we will test your
DFTwin() function.
Download the file
go.au , and load it into Matlab.
Plot the signal and locate a voiced region. Use your function tocompute a 512-point DFT of a speech segment, with a window that covers
six pitchperiods within the voiced region.
Subplot your chosen segment and the DFT magnitude
(for
from 0 to
) in the same figure. Label the frequency axis
in Hz, assuming a sampling frequency of 8 KHz. Remember that a radialfrequency of
corresponds to half the sampling frequency.
DFTwin() function, and your plot.
Describe the generalshape of the spectrum, and estimate the formant frequencies for the
region of voiced speech.Download the file signal.mat for the following section.
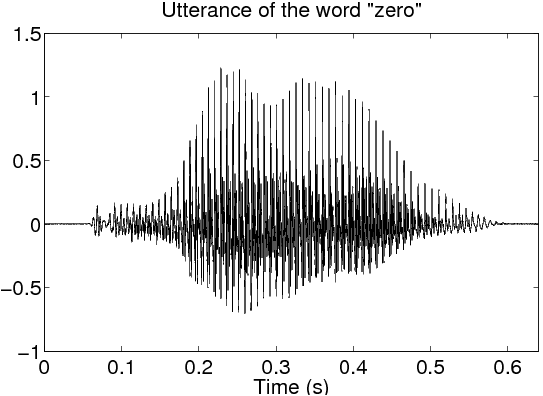
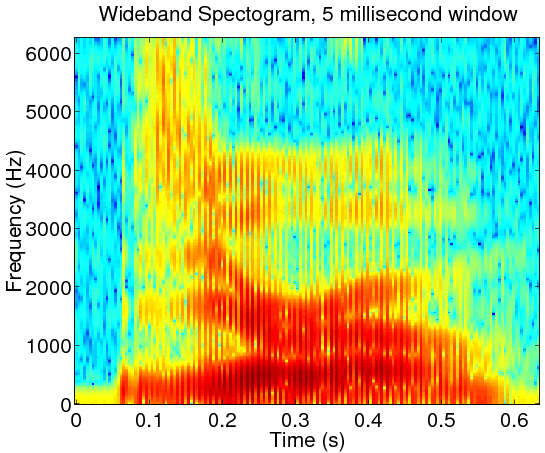
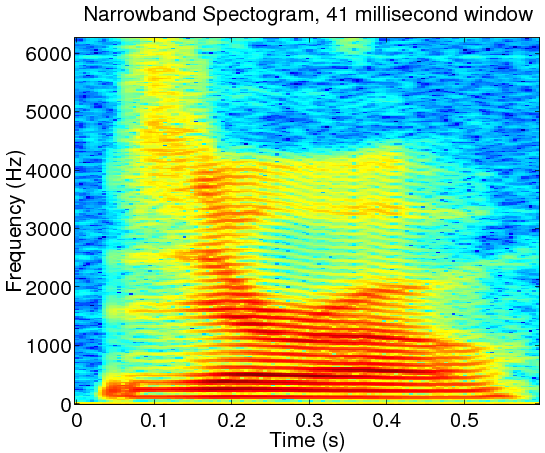
As previously stated, the short-time DTFT is a collection of DTFTs that differ by the position of the truncating window.This may be visualized as an image, called a spectrogram . A spectrogram showshow the spectral characteristics of the signal evolve with time. A spectrogram is created by placing the DTFTs vertically inan image, allocating a different column for each time segment. The convention is usually such that frequency increases from bottomto top, and time increases from left to right. The pixel value at each point in the image is proportional to themagnitude (or squared magnitude) of the spectrum at a certain frequency at some point in time.A spectrogram may also use a “pseudo-color” mapping, which uses a variety of colors to indicate the magnitude of the frequencycontent, as shown in [link] .


For quasi-periodic signals like speech, spectrograms are placed into two categories according to the length of the truncating window. Wideband spectrograms use a window with a length comparable to a single period. This yields high resolution in the time domain but low resolution inthe frequency domain. These are usually characterized by vertical striations, which correspond to high and low energy regions within asingle period of the waveform. In narrowband spectrograms, the window is made long enough to capture several periods of the waveform. Here,the resolution in time is sacrificed to give a higher resolution of the spectral content. Harmonics of the fundamental frequency of the signalare resolved, and can be seen as horizontal striations. Care should be taken to keep the window short enough, such that the signal properties stayrelatively constant within the window.
Often when computing spectrograms, not every possible window shift position is used from the stDTFT, as this would result in mostly redundant information.Successive windows usually start many samples apart, which can be specified in terms of the overlap between successive windows. Criteria in deciding the amount of overlap include the length of the window, the desired resolution in time, and the rate at which the signalcharacteristics are changing with time.

Notification Switch
Would you like to follow the 'Purdue digital signal processing labs (ece 438)' conversation and receive update notifications?