-
Home
- Calculating basic statistical
- Calculating basic statistical
- Conducting a parametric dependent
Step one:
- Compute Measures of Normality for the Dependent Variable
- √ Analyze
- * Descriptive Statistics
- * Frequencies
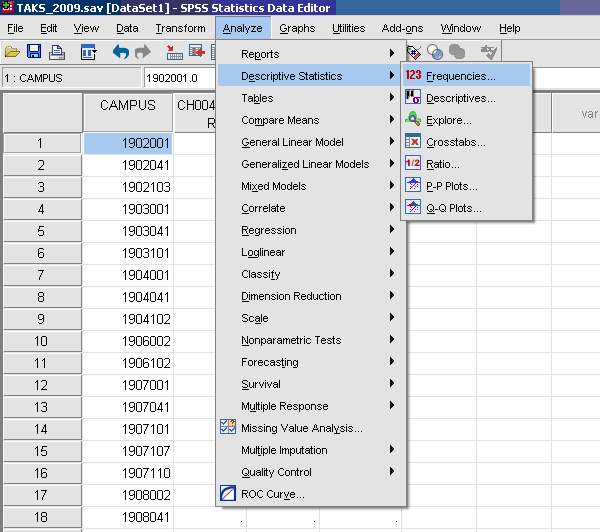
- √ Move over the dependent (outcome) variable
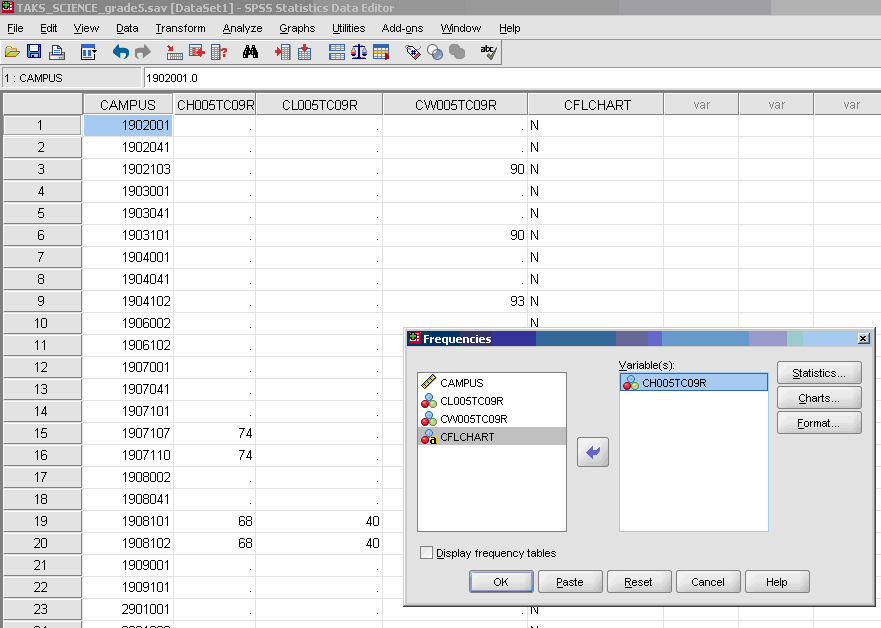
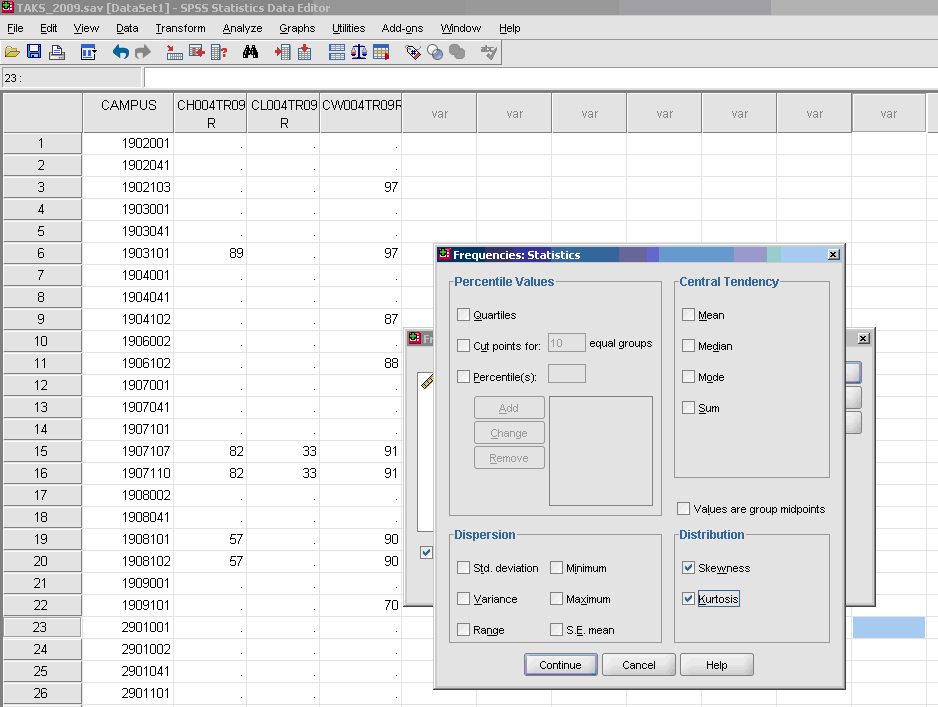
- √ Statistics
- * Skewness [Note. Skewness refers to the extent to which the data are normally distributed around the mean. Skewed data involve having either mostly high scores with a few low ones or having mostly low scores with a few high ones.] Readers are referred to the following sources for a more detailed definition of skewness:
(External Link)&term_id=356 and
(External Link)
- To standardize the skewness value so that its value can be constant across datasets and across studies, the following calculation must be made: Take the skewness value from the SPSS output and divide it by the Std. error of skewness. If the resulting calculation is within -3 to +3, then the skewness of the dataset is within the range of normality (Onwuegbuzie&Daniel, 2002). If the resulting calculation is outside of this +/-3 range, the dataset is not normally distributed.
- * Kurtosis [Note. Kurtosis also refers to the extent to which the data are normally distributed around the mean. This time, the data are piled up higher than normal around the mean or piled up higher than normal at the ends of the distribution.] Readers are referred to the following sources for a more detailed definition of kurtosis:
(External Link)&term_id=326 and
(External Link)
- To standardize the kurtosis value so that its value can be constant across datasets and across studies, the following calculation must be made: Take the kurtosis value from the SPSS output and divide it by the Std. error of kurtosis. If the resulting calculation is within -3 to +3, then the kurtosis of the dataset is within the range of normality (Onwuegbuzie&Daniel, 2002). If the resulting calculation is outside of this +/-3 range, the dataset is not normally distributed.
- * Continue
- * OK
- Uncheck the "display frequency tables" so that you are not provided with the frequencies of your data every time descriptive statistics are obtained.
Step two:
Check for Skewness and Kurtosis values falling within/without the parameters of normality (-3 to +3). Note that each variable below has its own skewness and its own kurtosis values. Thus, a total of three standardized skewness coefficients and three standardized kurtosis coefficients can be calculated from information in the table below.
|
|
CH005TC09R |
CL005TC09R |
CW005TC09R |
| N |
|
| Valid |
3125 |
1805 |
1877 |
| Missing |
5197 |
6517 |
6445 |
|
Skewness |
-1.129 |
-.479 |
-2.197 |
|
Std. Error of Skewness |
.044 |
.058 |
.056 |
|
Kurtosis |
1.818 |
-.412 |
6.991 |
|
Std. Error of Kurtosis |
.088 |
.115 |
.113 |
Skewness and Kurtosis Coefficients
-
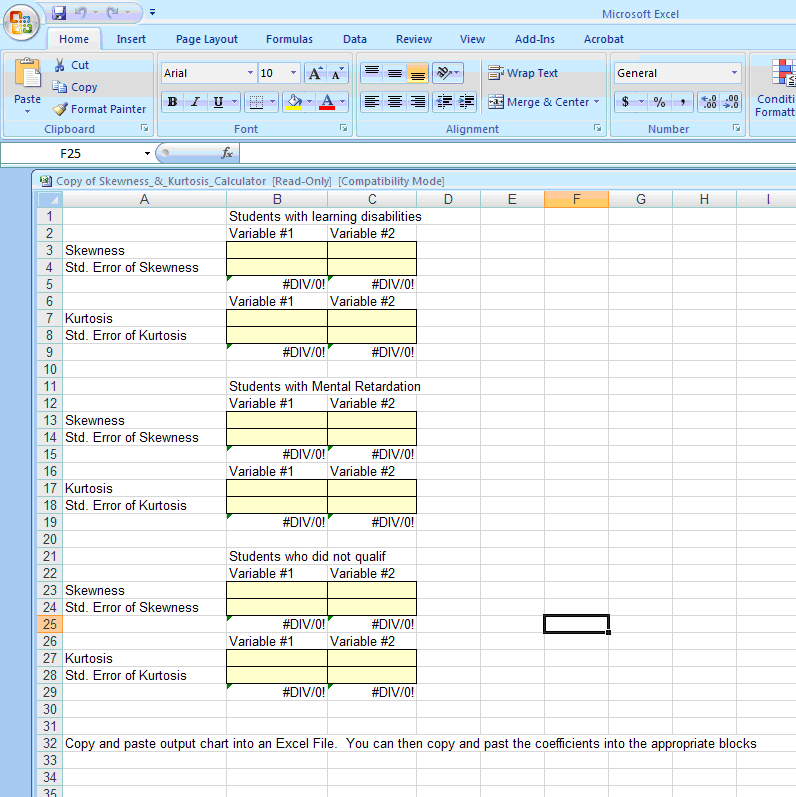
Standardized Coefficients Calculator
- Copy variable #1 and #2 into the skewness and kurtosis calculator
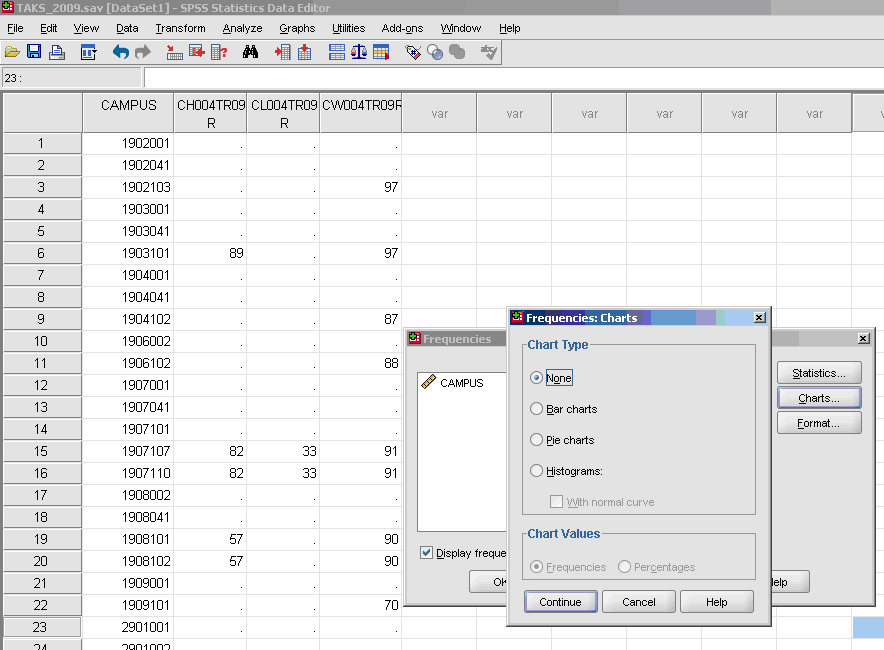
- √ Charts (these are calculated only if you wish to have visual depictions of skewness and of kurtosis-they are not required)
- * Histogram~ with normal curve (not required, optional)
Step three:
- Calculate Paired Samples
t -test on Data
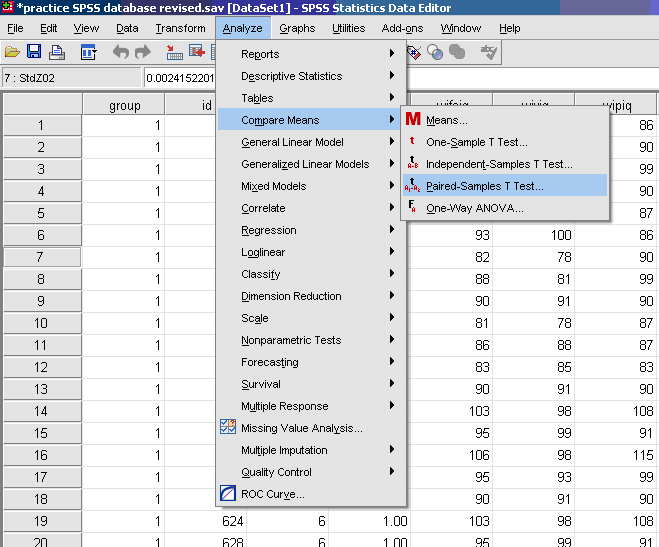
- √ Analyze
- √ Compare Means
- √ Paired samples
t -test
- √ Click on one dependent variable
- √ Arrow to send over to Paired Variables Side, Variable 1
Source:
OpenStax, Calculating basic statistical procedures in spss: a self-help and practical guide to preparing theses, dissertations, and manuscripts. OpenStax CNX. Apr 28, 2011 Download for free at http://cnx.org/content/col11292/1.6
Google Play and the Google Play logo are trademarks of Google Inc.
