| << Chapter < Page | Chapter >> Page > |

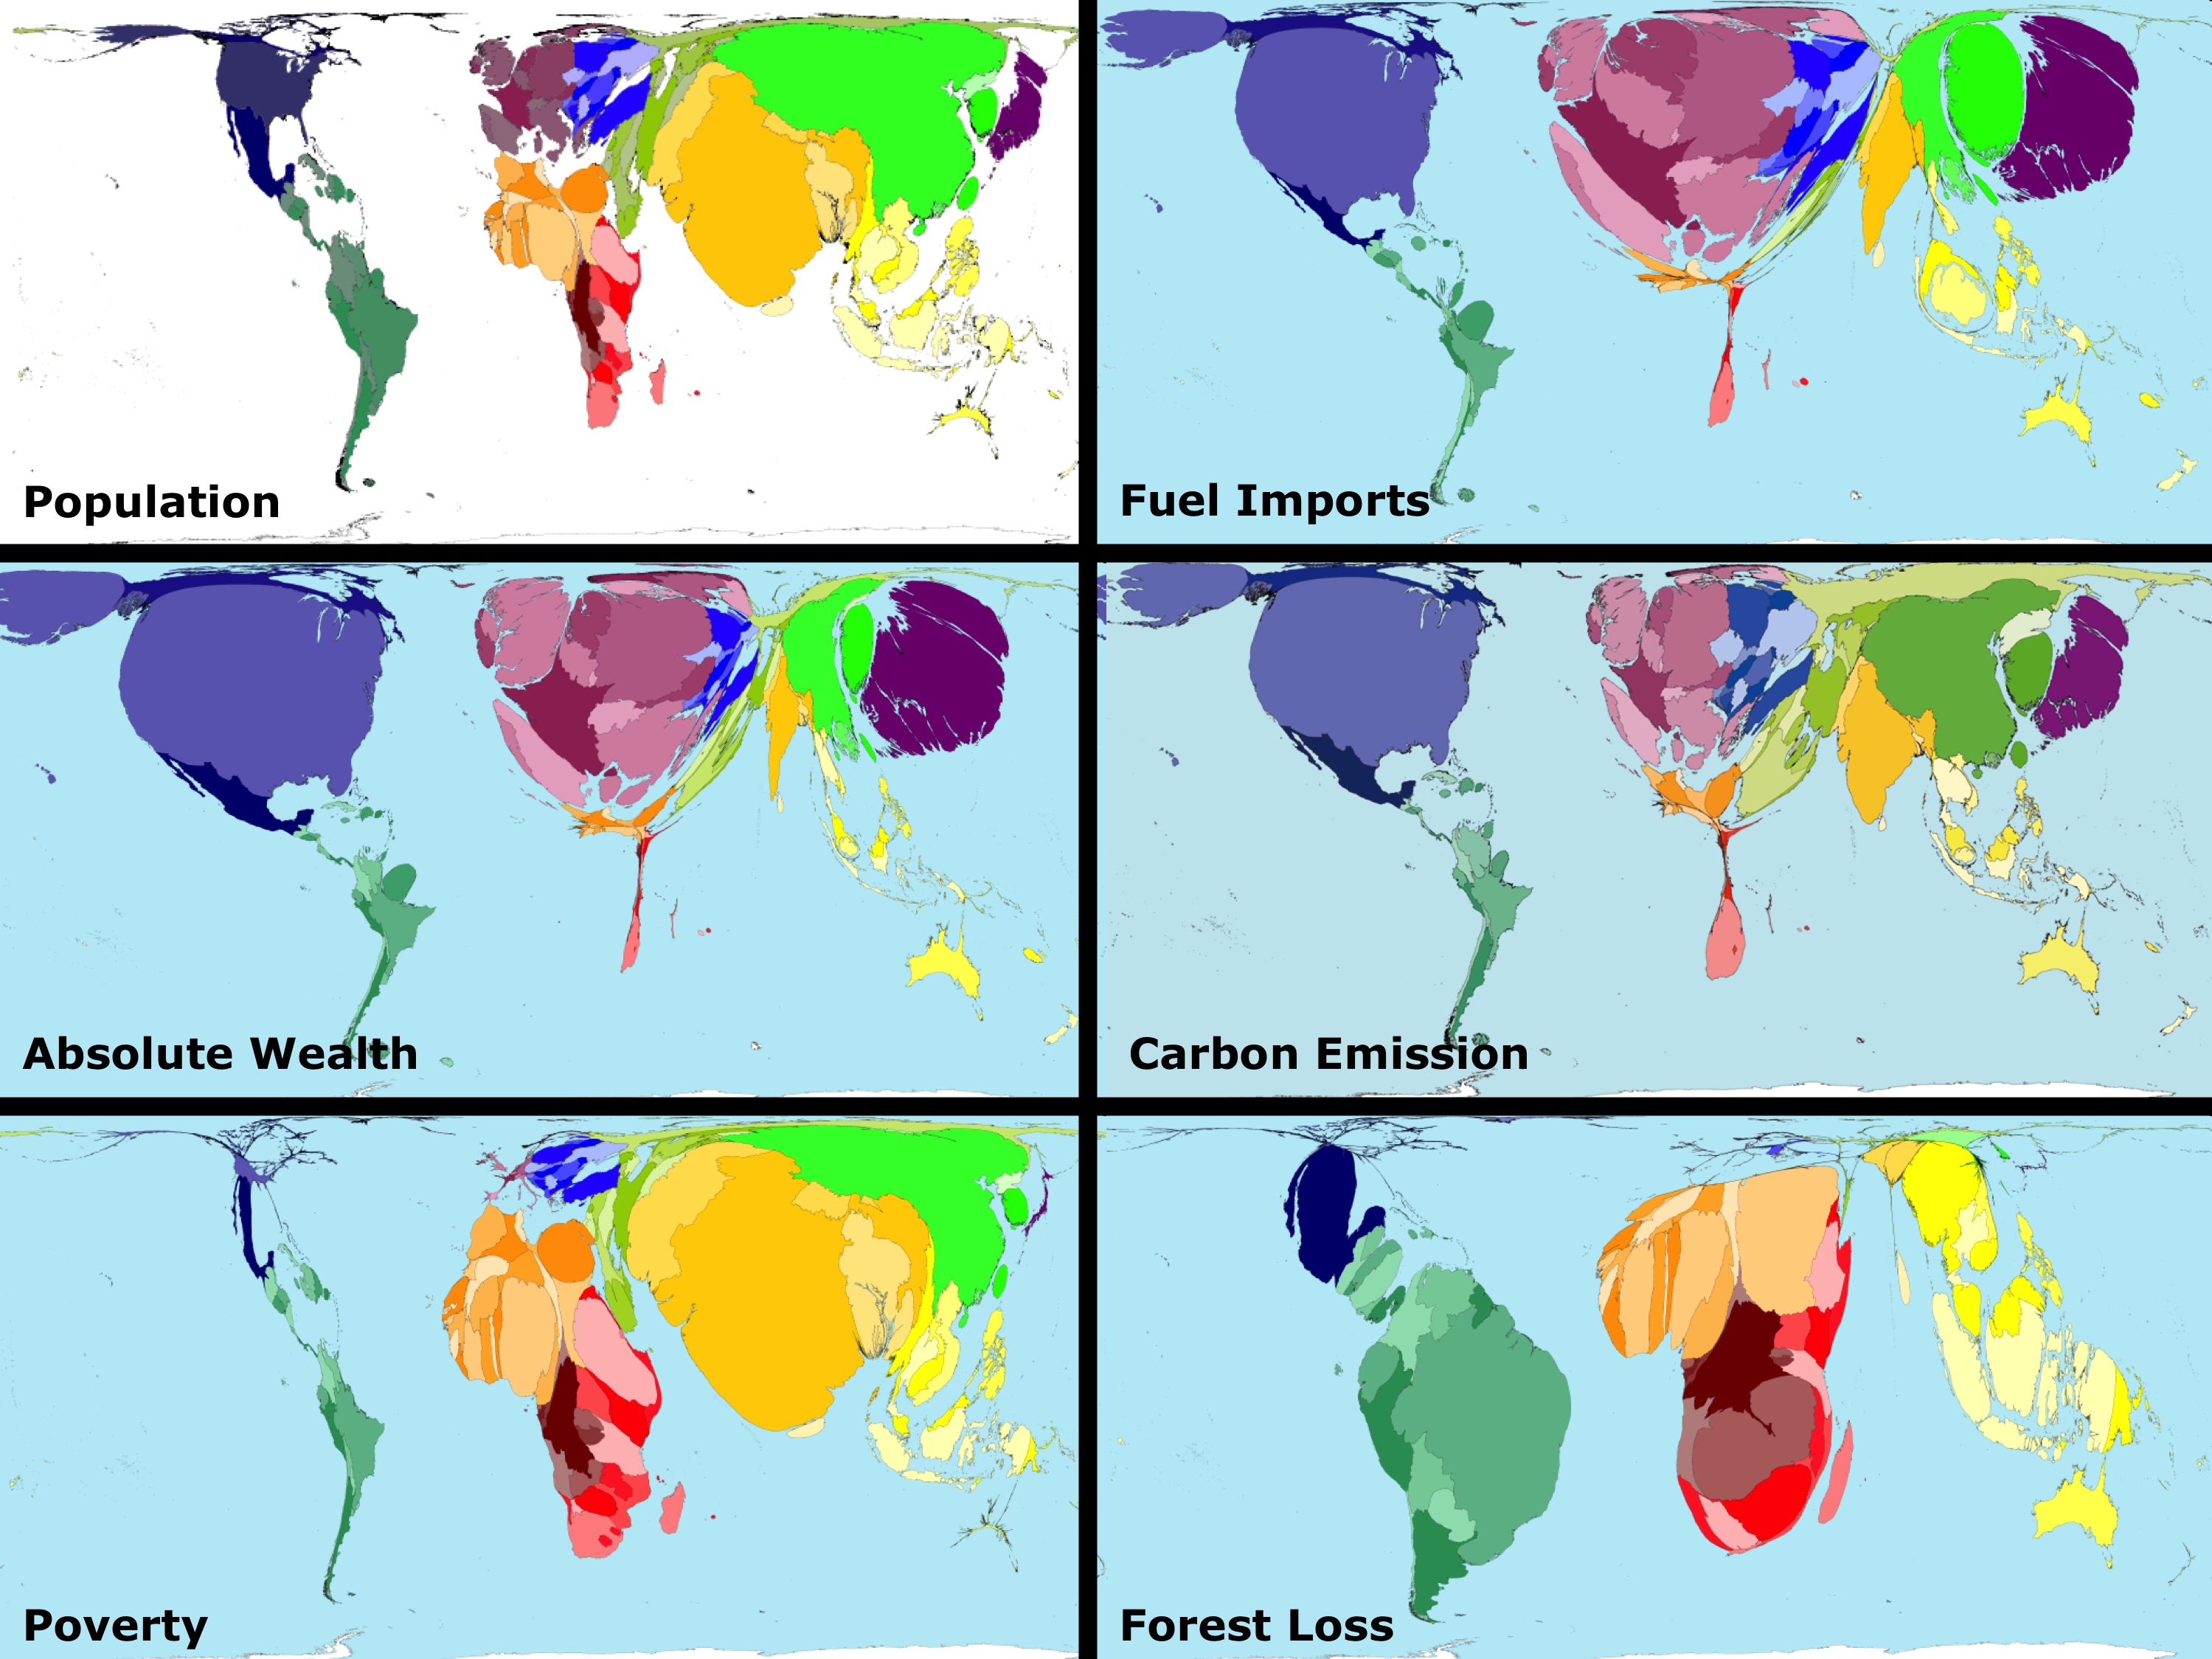
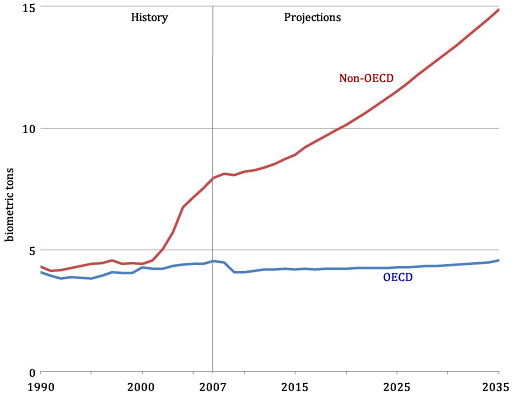
The last graph in Figure Global Influence Maps distorts each country’s size according to poverty. Much of Asia and Africa are distorted the most, and it is in these regions that we need to pay close attention over the upcoming years. Many of the nations found within these countries are what economists and politicians call “emerging economies.” Although much of the current abundance of CO 2 in the atmosphere is from developed countries such as the United States, CO 2 emissions from these countries are not increasing with time according to a 2008 report from the Energy Information Administration. In Figure Global CO 2 Emissions from Coal Combustion , the world’s CO 2 emissions from coal combustion in billions of metric tons are plotted against time. Notice that countries of the Organization for Economic Co-operation and Development (OECD), which comprises a large group of developed and industrialized nations, have not increased their CO 2 emissions from coal combustion since 1990, and future projections also reveal a flat line in CO 2 emissions. Compare this to the non-OECD countries, many of which are emerging economies like China and India, and you see that CO 2 emissions are set to triple in the next 25 years. There is much debate over information like this now that recent climate change has been linked so closely to anthropogenic emission of CO 2 . This debate revolves around the fact that developed nations used coal, oil, and natural gas during a time when the impacts of CO 2 and climate change were not well researched. This meant that during the time these countries, including the United States, industrialized there were no regulations on the emissions of CO 2 . Now that CO 2 emissions have been shown to cause global warming, pressure is being applied to these emerging economies to regulate and control their CO 2 emissions. This is subject of much of the debate at the international climate summits at Kyoto, Bali, and Copenhagen. What is important to remember when discussing developed countries vs. emerging economies is that the per capita emissions of CO 2 in emerging economies are approximately one third of those for developed countries.

One of the greatest obstacles climate scientists face in educating the public on issues of climate change is time. Most people take weather and climate to be one branch of scientific study. In reality, this could not be further from the truth. Weather and climate are two separate fields of study that are joined only by one definition—climate is the average of weather. It is important to understand this statement because people—news reporters, broadcast meteorologists, politicians, and even scientists—often make the mistake of attributing weather events, such as Hurricane Katrina (2005), to global climate change. Katrina was a weather event and, as such, it cannot be said to have been caused by global climate change. Are the ingredients for stronger hurricanes present in greater frequency now than they have been in the past? That’s the type of question climate scientists seek to answer, and they do so by analyzing decades worth of data. Thirty years is the lowest value used in the denominator of climate calculations. In other words, 30 years is the shortest time period over which weather can be averaged to extract climate information. Therefore, it is impossible to blame a single weather event on climate change—this branch of science does not work that way.

Notification Switch
Would you like to follow the 'Sustainability: a comprehensive foundation' conversation and receive update notifications?