| << Chapter < Page | Chapter >> Page > |
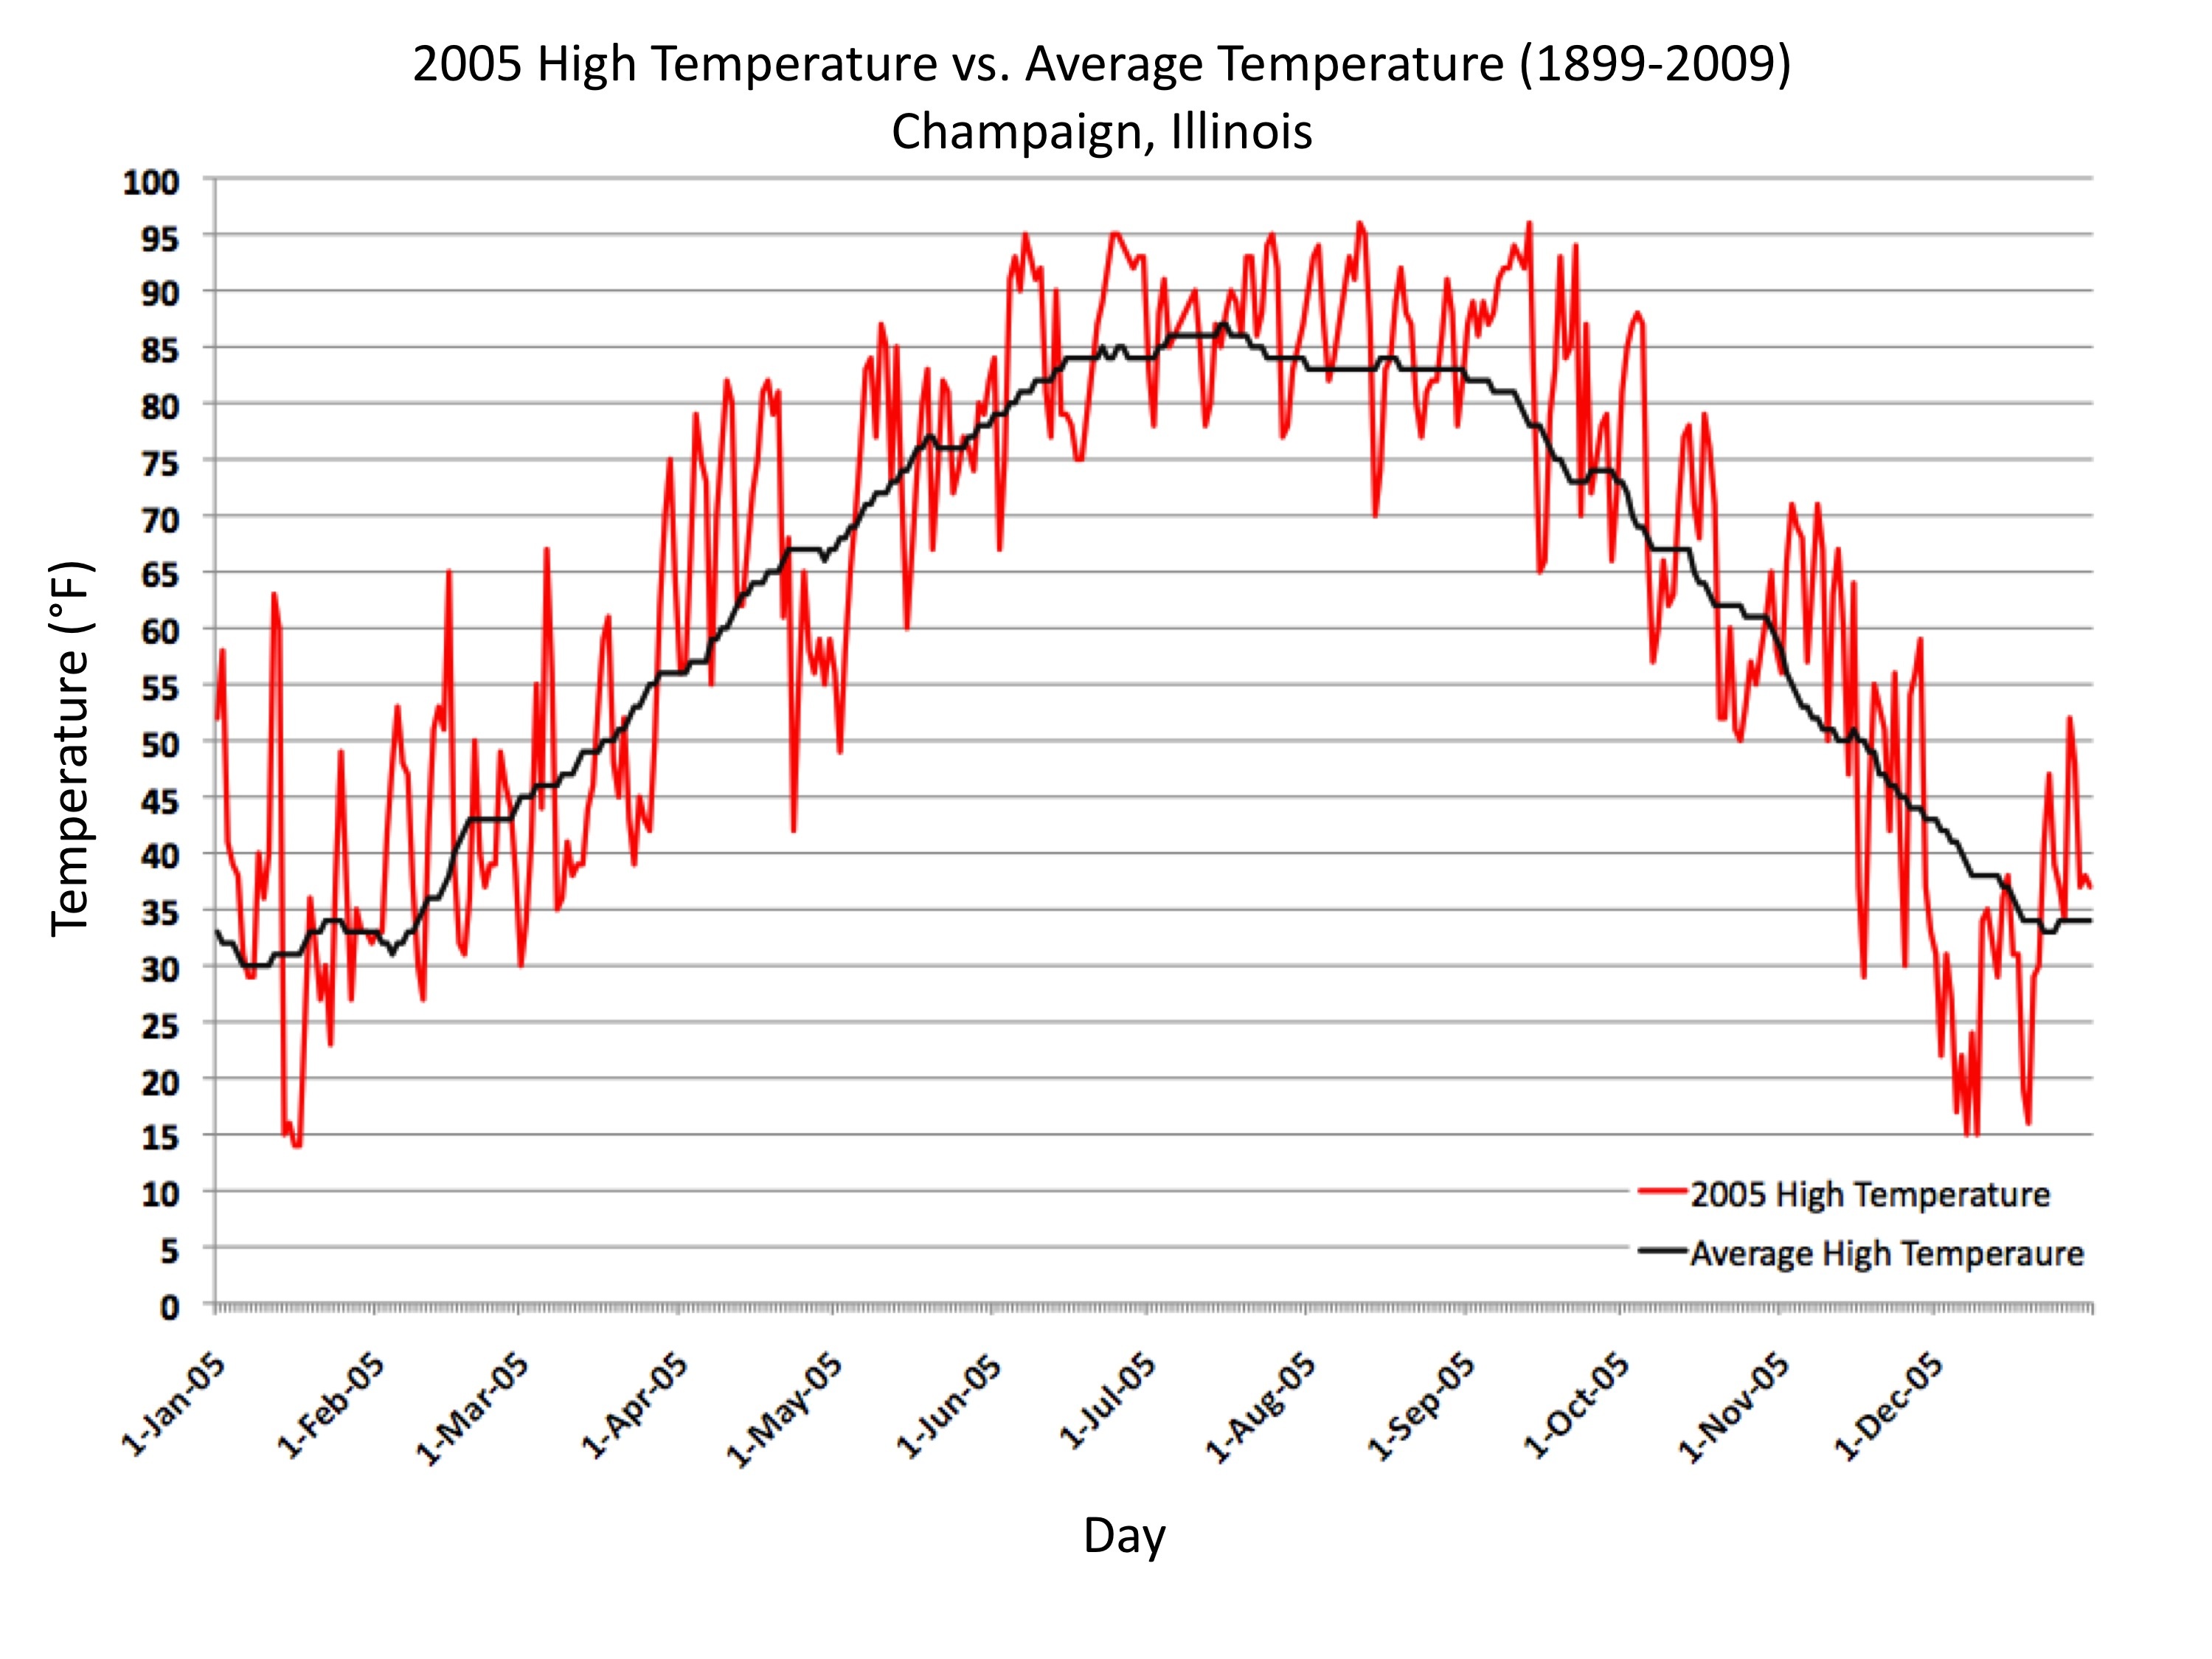
To better understand the differences between weather and climate, take a look at Figure High Temperature vs. Low Temperature, Champaign, IL which shows in red the actual high temperatures for each day in 2005 in Champaign, Illinois, compared to the average high temperature in black over a period beginning in 1899 and ending in 2009. It is completely normal for the temperature to vary ±20°F around this average. In 2005 there were only a handful of days where the actual high was the same as the average high. This graph shows the highly variable and chaotic behavior of weather. But, when data from a long span of time is averaged, the climatological mean emerges.

To think of it another way, imagine you are in a large lecture hall with over 300 college students. If the professor were to call out one student and try to predict the course of her life over the next 70 years it would be nearly impossible! It would even be difficult to predict when that person would eat her next meal. However, the professor could project with great confidence that on average, most of the people in the room will eat dinner at 6:30PM on a given night. Beyond this meal, most of them will graduate from college by the time they are 22 years old. Many will be married by 27 years old and have their first children at 30. Most will have a job by the time they are 24 and most will have a job they like by 34. Most will have a total of 2.1 children by the time they are 36, and by the time they are 50 most will have gone to the doctor to have their first routine procedure. Most will retire at 67, and since they are college grads in the United States, there is a safe bet that they will retire with over a million dollars in assets. On average, the men in the room will die at 85 years old and most of the women will die before their ninetieth birthday. Now, if the professor were to single out one individual, the chances that her life would follow this path exactly are small, but when an entire class of 300 is averaged, this is the result. Weather is like the individual life. Climate is like the average of 300 lives. Weather and Climate are two separate branches of study in atmospheric science.
In addition to keeping in mind the difference between weather and climate, remember that the focus of this chapter is global climate change. It is tempting to forget the global nature of this problem because it is happening very slowly on a large scale and it is averaged over long time periods. Recall the differences between weather and climate and remember that in conjunction with global warming there can still be weather events that take temperatures far below normal. The temptation during these events is to discount the science behind global climate change. For example, during the winter of 2009-2010, the weather patterns were such that the east coast of the United States experienced repeated record-setting snowstorms and cold air outbreaks. Many television news reports, weather broadcasts, and newspaper headlines scoffed at the idea of global warming during this winter and proclaimed that it was not happening or that it was a hoax. The shortsightedness of such responses is evidenced by the fact that globally , 2009 and 2010 were among the warmest years during the instrument record: 2009 ranked seventh, and 2010 tied for first. These were likely two of the warmest years of the last 1,300.

Notification Switch
Would you like to follow the 'Sustainability: a comprehensive foundation' conversation and receive update notifications?