| << Chapter < Page | Chapter >> Page > |
Seven eighth graders at Kennedy Middle School measured how far they could push the shot-put with their dominant (writing) hand and their weaker (non-writing) hand. They thought that they could push equal distances with either hand. The data were collected and recorded in [link] .
| Distance (in feet) using | Student 1 | Student 2 | Student 3 | Student 4 | Student 5 | Student 6 | Student 7 |
|---|---|---|---|---|---|---|---|
| Dominant Hand | 30 | 26 | 34 | 17 | 19 | 26 | 20 |
| Weaker Hand | 28 | 14 | 27 | 18 | 17 | 26 | 16 |
Conduct a hypothesis test to determine whether the mean difference in distances between the children’s dominant versus weaker hands is significant.
Record the differences data. Calculate the differences by subtracting the distances with the weaker hand from the distances with the dominant hand. The data for the differences are: {2, 12, 7, –1, 2, 0, 4}. The differences have a normal distribution.
Using the differences data, calculate the sample mean and the sample standard deviation. = 3.71, = 4.5.
Random variable: = mean difference in the distances between the hands.
Distribution for the hypothesis test: t 6
H 0 : μ d = 0 H a : μ d ≠ 0
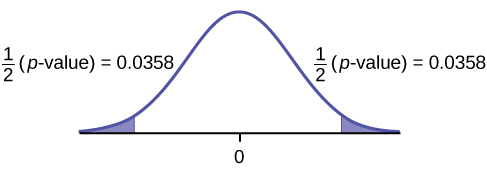
Graph:

Calculate the p -value: The p -value is 0.0716 (using the data directly).
(test statistic = 2.18. p -value = 0.0719 using
Decision: Assume α = 0.05. Since α < p -value, Do not reject H 0 .
Conclusion: At the 5% level of significance, from the sample data, there is not sufficient evidence to conclude that there is a difference in the children’s weaker and dominant hands to push the shot-put.
Five ball players think they can throw the same distance with their dominant hand (throwing) and off-hand (catching hand). The data were collected and recorded in [link] . Conduct a hypothesis test to determine whether the mean difference in distances between the dominant and off-hand is significant. Test at the 5% level.
| Player 1 | Player 2 | Player 3 | Player 4 | Player 5 | |
|---|---|---|---|---|---|
| Dominant Hand | 120 | 111 | 135 | 140 | 125 |
| Off-hand | 105 | 109 | 98 | 111 | 99 |
The p -level is 0.0230, so we can reject the null hypothesis. The data show that the players do not throw the same distance with their off-hands as they do with their dominant hands.
A hypothesis test for matched or paired samples (t-test) has these characteristics:
Test Statistic ( t -score): t =
where:
is the mean of the sample differences. μ d is the mean of the population differences. s d is the sample standard deviation of the differences. n is the sample size.
Use the following information to answer the next five exercises. A study was conducted to test the effectiveness of a software patch in reducing system failures over a six-month period. Results for randomly selected installations are shown in [link] . The “before” value is matched to an “after” value, and the differences are calculated. The differences have a normal distribution. Test at the 1% significance level.

Notification Switch
Would you like to follow the 'Statistics i - math1020 - red river college - version 2015 revision a - draft 2015-10-24' conversation and receive update notifications?