| << Chapter < Page | Chapter >> Page > |
In theory, it would be possible to produce a perfect square wave in this fashion. Unfortunately, an infinite number of sinusoidal terms would be requiredto achieve the square corners, flat top, no ripples, and vertical sides of the perfect square wave. In practice, we normally have to make do with somethingless than perfect.
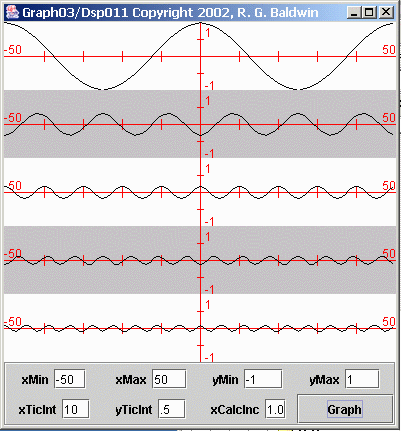
Figure 7 shows individual plots of the first five sinusoidal terms required to approximate the square wave.
| Figure 7. First five sinusoidal components of a square waveform. |
|---|
 |
Each of the terms in the previous expression has an associated algebraic sign.
(You may have noticed that the sign applied to every other term in the expression is negative, causing every other term to plot upside down in Figure 7 .)
The bottom curve in Figure 5 is the point-by-point sum of the five curves shown in Figure 7 .
If you view Figure 7 side-by-side with Figure 5 , you should be able to see how the sinusoidal terms add and subtract to produce the desired result. Forexample, the subtraction of the second sinusoidal term from the first sinusoidal term knocks the peaks off the first term and produces a noticeable shift from acosine towards a square wave.
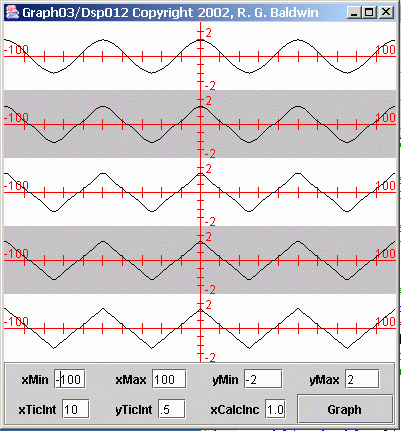
As another example of composition, suppose that I need to create a time series that approximates a triangular waveform, as shown at the bottom of Figure 8 .
| Figure 8. A triangular waveform. |
|---|
 |
I can create such a waveform by adding together the right combination of sinusoids, each having its own amplitude and frequency.
The time series at the bottom of Figure 8 was created by adding together five cosine waves, each having the amplitude and frequency values shown in thefollowing expression:
f(x) = cos(2*pi*x/50)
+ cos(2*pi*x*3/50)/9+ cos(2*pi*x*5/50)/25
+ cos(2*pi*x*7/50)/49+ cos(2*pi*x*9/50)/81
The top waveform in Figure 8 is a plot of the cosine curve created from the sinusoidal first term in the expression shown above.
The second waveform from the top in Figure 8 is the sum of the first two terms in the above expression.
The third waveform is the sum of the first three terms. By this point, the plot has begun to resemble a triangular waveform in a significant way.
The fourth waveform is the sum of the first four terms, and the fifth waveform is the sum of all five terms.
By examining the waveforms from top to bottom in Figure 8 , you can see how the addition of each successive term causes the resulting waveform to moreclosely approximate the desired triangular shape.
Figure 8 shows that only five terms are required to produce a fairly good approximation to a triangular waveform.
A comparison of Figure 8 with Figure 5 shows that five terms are much more effective in approximating a triangular waveform than were the five terms inapproximating a square waveform. The triangular waveform is easier to approximate because it doesn't have a flat top and vertical sides.
Other waveforms exhibit greater or lesser degrees of difficulty in creation through composition.

Notification Switch
Would you like to follow the 'Digital signal processing - dsp' conversation and receive update notifications?