<< Chapter < Page Chapter >> Page >
This figure is a flow chart progressing from left to right. On the upper left hand side is the phrase Complex Sampled Channel Inputs, below which are three mathematical expression. The first expression is x_0(r) with an arrow pointing to the right. The second expression is x_1(r) with another arrow pointing to the right. The third row only has an arrow pointing to the right, but the fourth row has the expression x_(N-1)(r) with an arrow pointing to the right. All of the arrows point to a rectangle containing the phrase DFT of Order N at Rate f_s/M. A large block arrow points to the right from the first rectangle to another rectangle containing the phrase Buffer Q Most Recent DFT Output Vectors. Then another block arrow points to the right to another rectangle containing the phrase Compute H^TpD_p(r) for each p for Every r. To the right of this rectangle is a series of 8 lines ending in dots. These line are longer on the upper and lower extremes and get shorter as the progress towards the middle. Above these lines is the expression p=0 and below is the expression p=N-1. To the right of this series of lines is an expression y(r,p)=y(k) at rate f_s with an arrow pointing to the left at the space between the second and third lines from the top in the previous series of lines.
Block Diagram of the Computational Steps Needed for a Basic TDM-FDM Transmultiplexer

Relationship between the basic tdm-fdm and fdm-tdm transmultiplexers

We immediately observe that this computation is exactly that required to demultiplex all N channels in a basic FDM-to-TDM transmux. In fact, the FDM-TDM and TDM-FDM transmultiplexers are mathematical duals of each other and virtually any manipulation feasible with one has its analog in the other. They are not precisely the same, however. An example is the definition of Q and Q ¯ . The former depends on f s and N , the number of channels, while the latter depends on f s and M , the interpolation factor. For the basic transmux equations N = M and the two are identical, but the fundamental relationship is duality, not equality.

Practically, however, many things are the same. The computation rate has already been shown to be the same (when the pulse response durations are the same) and the block diagrams are reversed forms of each other. A few other practical observations can be made:

  • Picking M is tantamount to choosing f s .
  • Making M = N is equivalent to making the channel tuning frequencies equal to the centers of the images created by the zero-filling.
  • The pulse response h ( ) controls how much of x n ( r ) leaks into other FDM channels. The design of h ( ) is a compromise between the degree of acceptable passband amplitude distortion, the degree to which the images of the input signal must be suppressed, and the filter order L , which proportionally influences the computation needed for the transmultiplexer.

A pair of examples

What is an FDM-TDM Transmultiplexer describes several general uses for the FDM-TDM transmultiplexer and The Impact of Digital Tuning on the Overall design of an FDM-TDM Transmux examined several case histories of such transmultiplexers when used to solve practical problems. Such depth is not appropriate here, but it useful to see ways in which the TDM-FDM transmultiplexer is used.

[link] (a) shows a commercial telephone switching application. Several FDM signals enter the system and are demultiplexed by using FDM-TDM transmultiplexers. The demultiplexed channels are presented in a TDM form to the digital switch that reorganizes the voice channel samples in the TDM stream based on the customer's dialled number. The output TDM data is then converted back to FDM form by using TDM-to-FDM transmultiplexers. While it may seem curious to convert to TDM form to perform the switching, it is commonly done owing to the low cost of digital switching, the high cost of direct switching (for example, translating) of FDM channels, and the large number of existing analog transmission systems [circa the 1980s].
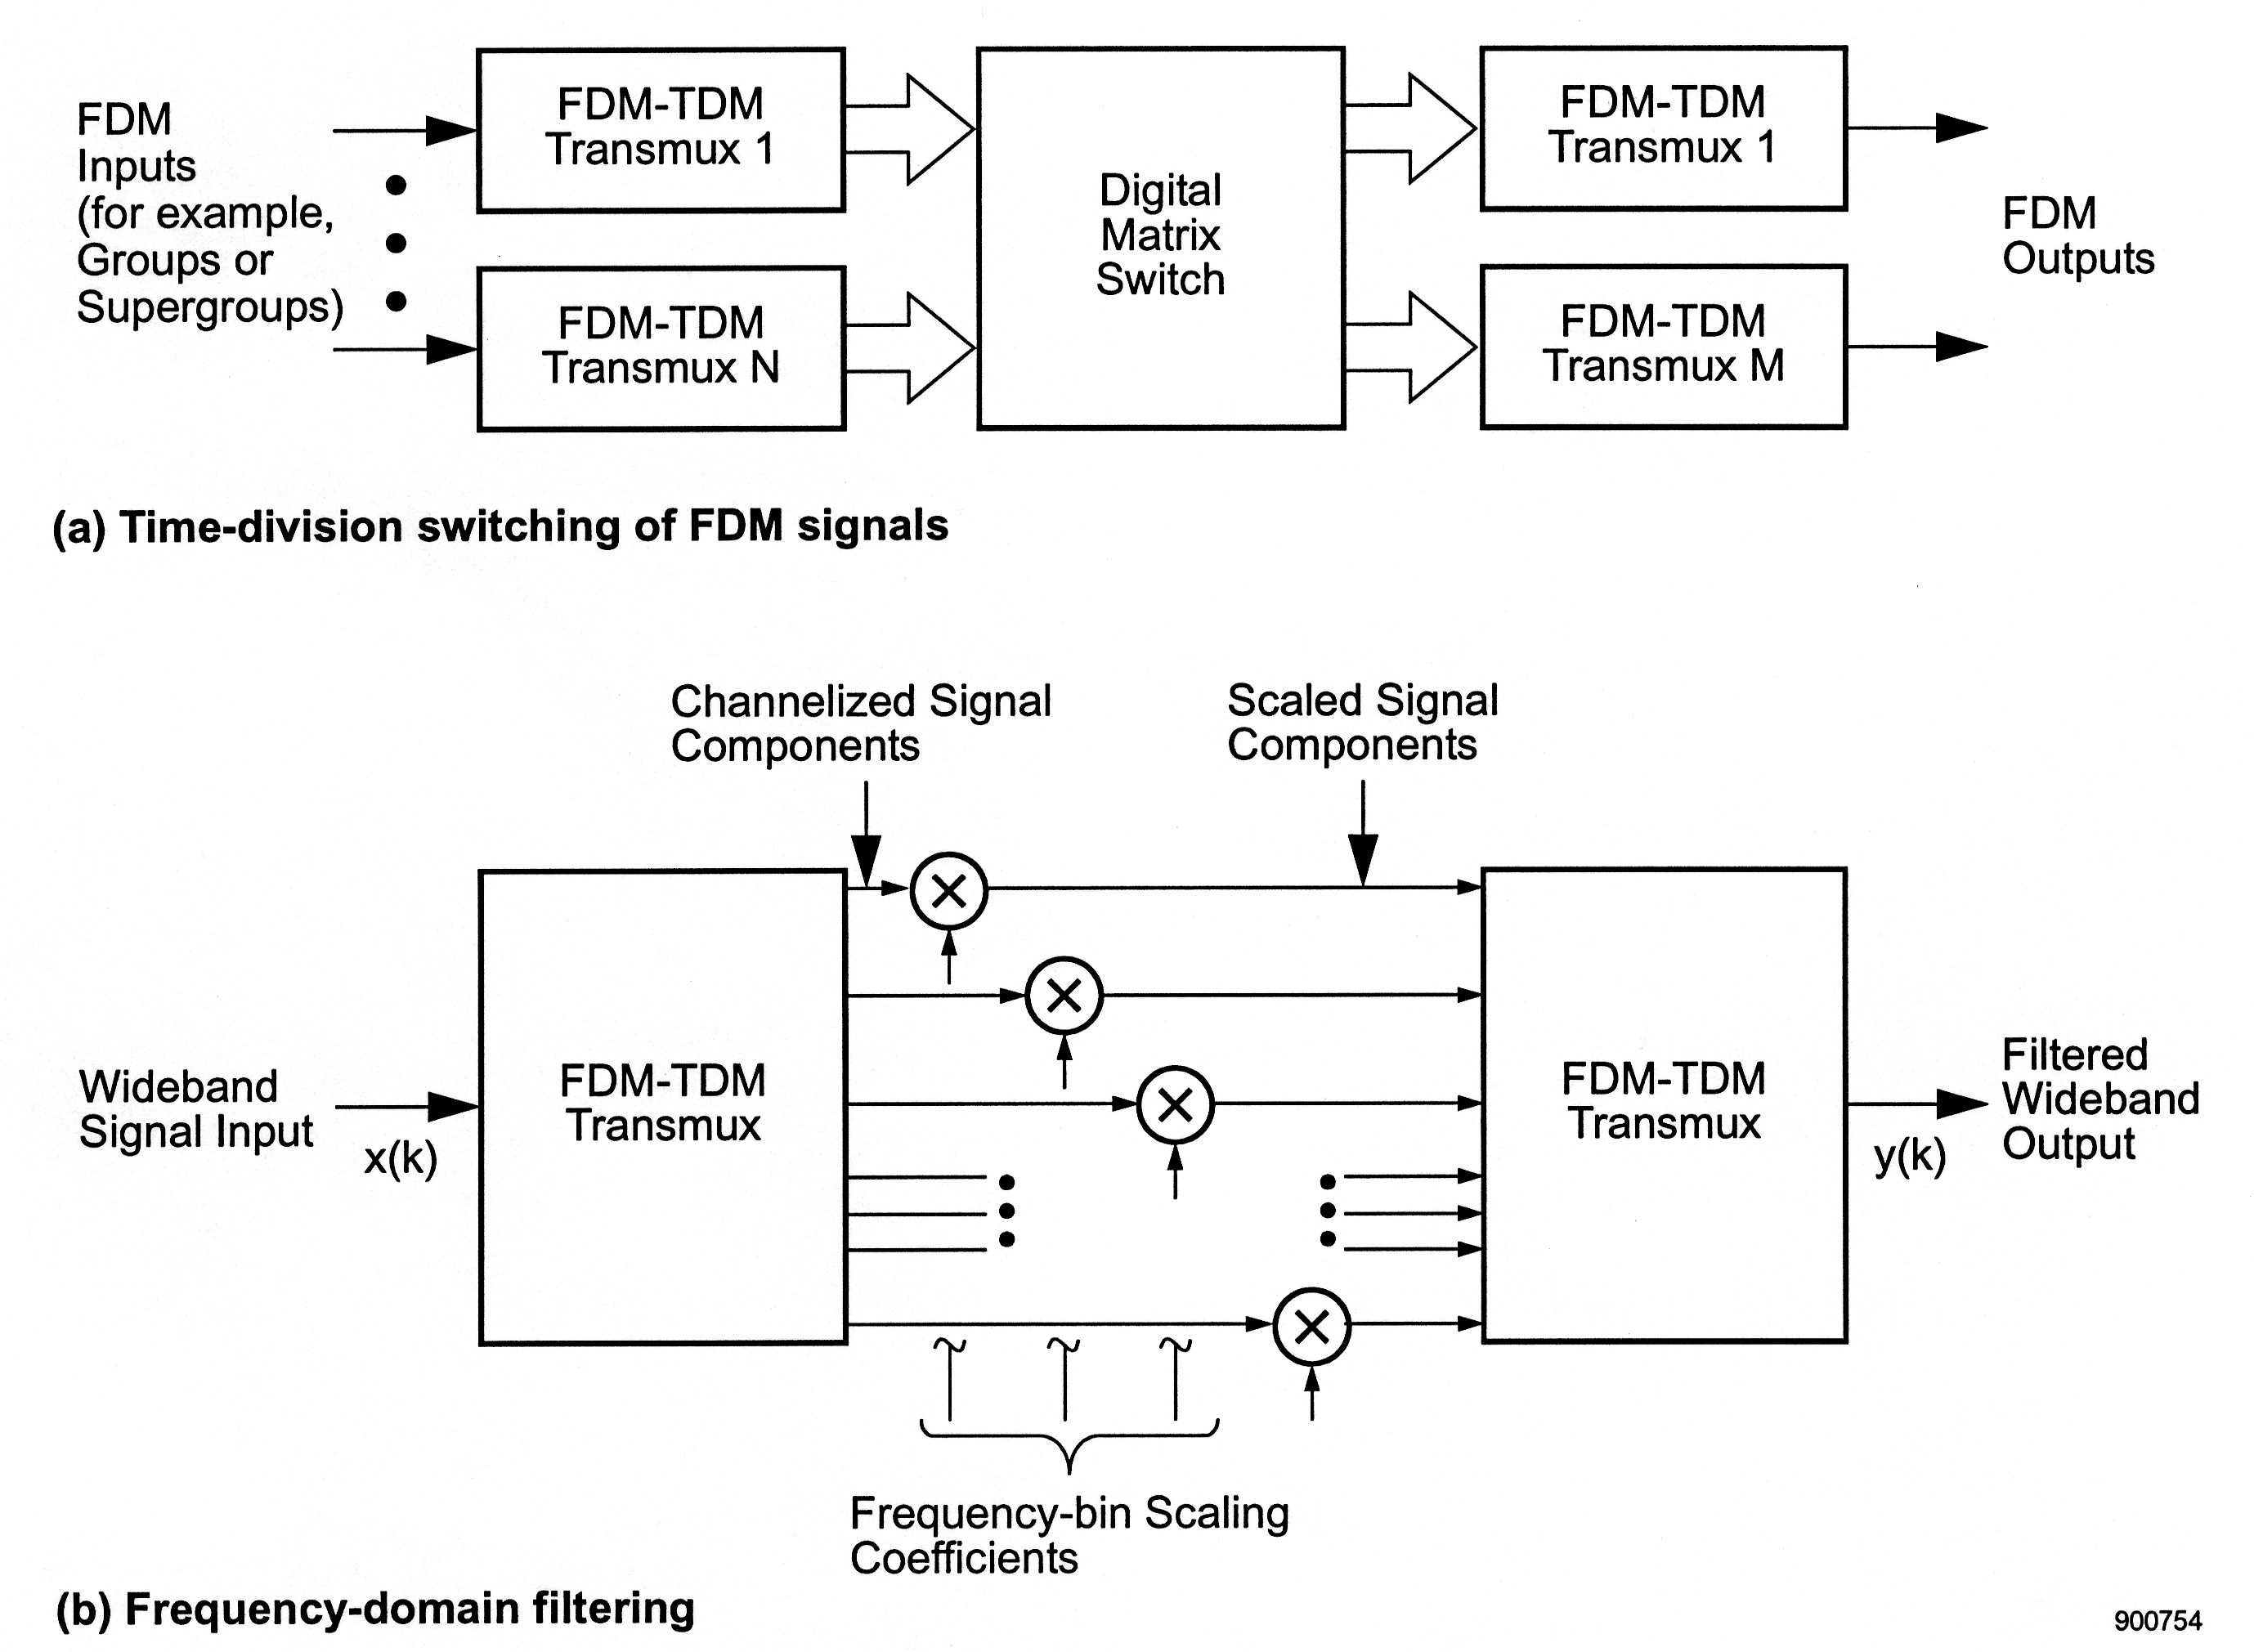
This image consist of two figures. The first image is labeled (a) Time-division switching of FDM signals and is a flow graph. The flow begins on the left with the phrase FDM Inputs (for example, Groups or Supergroups) then two parallel arrows point to the left to two parallel rectangles. In between these two arrows is a vertical line of three dots. The upper rectangle contains the phrase FDM-TDM transmux 1, while the lower rectangle contains the phrase FDM-TDM transmux N. Two block arrows point to the left to a single large square labeled Digital Matrix Switch. Two more block arrows point to the right to two parallel rectangles. The upper recrtangle contains the phrase FDM-TDM Transmux 1, and the lower rectangle is labeled FDM-TDM Transmux M. Next two more small arrows point to the right and in between these arrows and to the right is the phrase FDm Outputs. The second image is labeled Frequency-domain filtering. This is another flow graph. On the left hand side is the phrase Wideband signal input. An arrow points for this phrase to the right with the expression x(k) underneath the arrow. To the right of the arrow is a large rectangle that contains the phrase FDM-TDM Transmux. There are a series of these arrows and figures that point to another large rectangle further on the right. Th e first row of this series of arrows has a short arrow point to the right to a circle containing an x. This small arrow has another arrow pointing at it from above where there is the phrase Channelized Signal Components. To the right of the circle is another arrow pointing to the right large rectangle. The second line progresses much the same way. An arrow points to the right to a circle containing an x. This line is a little longer the the line in the first row, so that the circle is below and to the right of the upper circle. Another arrow points up to the first circle from this line. Another arrow continues to the right until it reaches the other large rectangle. The third row is the same as the second except that the first arrow is a little longer than the previous first arrow and another arrow points from this arrow to the second circle and the circle containing the x is below and to the right of the previous circle. A final arrow points to the right large rectangle. The fourth row consist of three small parallel line segments that extend to right with dots at the end and then the mirror three dots with three small parallel arrows pointing to the right large rectangle. Between these two sets of arrows is a gap and an arrow points up in this gap to the circle in the previous row. The fifth row is more similar to the first three rows. There is an arrow pointing to the right towards an circle containing and x. This arrow is longer the other rows arrow resulting in the cirlce being below and to the right of the other arrows. Below this arrow is a group of three veritcal lines ending in tildes which are grouped with a curly brace on the bottom with the phrase Frequency-bin Scaling Coefficients. To the right of the circle is another arrow pointing to the right large rectangle. To the right of this rectangle is an arrow under which is the expression y(k) and the arrow points to the phrase Filtered Wideband Output.
Two Applications of TDM-FDM Transmultiplexers

[link] (b) shows another example of a TDM-to-FDM transmultiplexer, this one also paired with a FDM-TDM transmultiplexer. The objective of this architecture is to form an easily controlled, high-resolution digital FIR filter. The input signal is decomposed into N unique bins centered at multiples of f s N Hz, where f s is the input sampling rate. The output of each bin is scaled by its own gain w n and then applied to a TDM-FDM transmultiplexer, whose output is the filter output. If the weighting functions for the two transmultiplexers, h f ( ) and h t ( ) , respectively, are chosen so that each equivalent tuner has bandwidth of about f s N , then it can be seen that this structure resembles a graphic equalizer of the type used in stereo equipment. If all gains { w n } are equal to unity, then the input signal is decomposed and then recomposed without significant change. If energy at a specific frequency needs to be removed from the output, then all weights except the one corresponding to the bin with the offending energy are set to unity while that one is lowered, potentially to zero. The concept carries forward to the design of filters with rather general amplitude and phase responses with the proper choice of the weights. The pulse response of the structure has duration of about L f + L t = ( Q f + Q t ) N , depending on how h f and h t are selected, and the filter has N degrees of freedom.

Why is this filter structure attractive if it offers the user fewer degrees of freedom in pulse response selection than the effective length of the filter pulse response? The answer comes in its ease of control. A single change in a single coefficient of a conventional transversal FIR filter changes the frequency response of the filter at all frequencies. Conversely, with the transmultiplexer/channel bank approach, the change of one coefficient affects only a spectral band known a priori to the user.

This type of behavior makes it well suited to use in adaptive digital filters, and particularly in those whose purpose is to remove concentrated interfering signals from the signal of actual interest to the user. An FDM-TDM/TDM-FDM transmultiplexer pair used to build such an adaptive filter is described in [link] .

Get Jobilize Job Search Mobile App in your pocket Now!

Get it on Google Play Download on the App Store Now


Source:  OpenStax, An introduction to the fdm-tdm digital transmultiplexer. OpenStax CNX. Nov 16, 2010 Download for free at http://cnx.org/content/col11165/1.2
Google Play and the Google Play logo are trademarks of Google Inc.

Notification Switch

Would you like to follow the 'An introduction to the fdm-tdm digital transmultiplexer' conversation and receive update notifications?

Ask