| << Chapter < Page | Chapter >> Page > |

The generation of genetic maps requires markers, just as a road map requires landmarks (such as rivers and mountains). Early genetic maps were based on the use of known genes as markers. More sophisticated markers, including those based on non-coding DNA, are now used to compare the genomes of individuals in a population. Although individuals of a given species are genetically similar, they are not identical; every individual has a unique set of traits. These minor differences in the genome between individuals in a population are useful for the purposes of genetic mapping. In general, a good genetic marker is a region on the chromosome that shows variability or polymorphism (multiple forms) in the population.
Some genetic markers used in generating genetic maps are restriction fragment length polymorphisms (RFLP), variable number of tandem repeats (VNTRs), microsatellite polymorphisms , and the single nucleotide polymorphisms (SNPs). RFLPs (sometimes pronounced “rif-lips”) are detected when the DNA of an individual is cut with a restriction endonuclease that recognizes specific sequences in the DNA to generate a series of DNA fragments, which are then analyzed by gel electrophoresis. The DNA of every individual will give rise to a unique pattern of bands when cut with a particular set of restriction endonucleases; this is sometimes referred to as an individual’s DNA “fingerprint.” Certain regions of the chromosome that are subject to polymorphism will lead to the generation of the unique banding pattern. VNTRs are repeated sets of nucleotides present in the non-coding regions of DNA. Non-coding, or “junk,” DNA has no known biological function; however, research shows that much of this DNA is actually transcribed. While its function is uncertain, it is certainly active, and it may be involved in the regulation of coding genes. The number of repeats may vary in individual organisms of a population. Microsatellite polymorphisms are similar to VNTRs, but the repeat unit is very small. SNPs are variations in a single nucleotide.
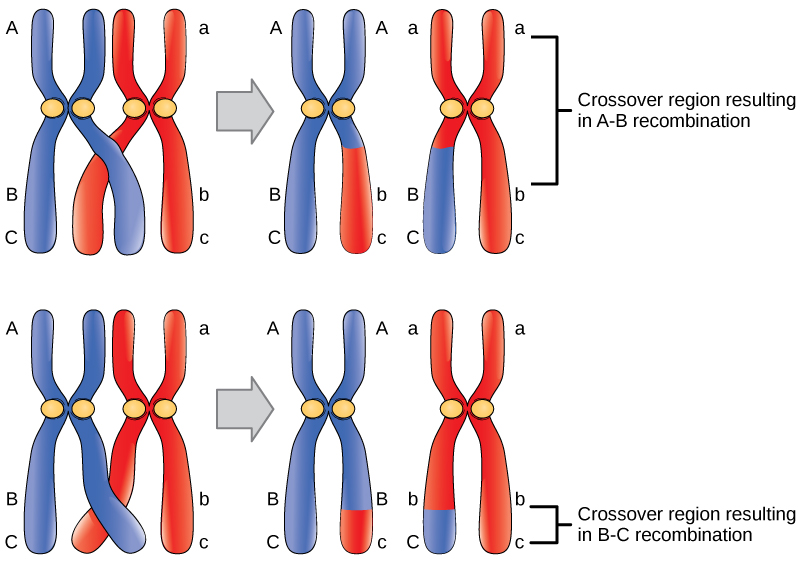
Because genetic maps rely completely on the natural process of recombination, mapping is affected by natural increases or decreases in the level of recombination in any given area of the genome. Some parts of the genome are recombination hotspots, whereas others do not show a propensity for recombination. For this reason, it is important to look at mapping information developed by multiple methods.
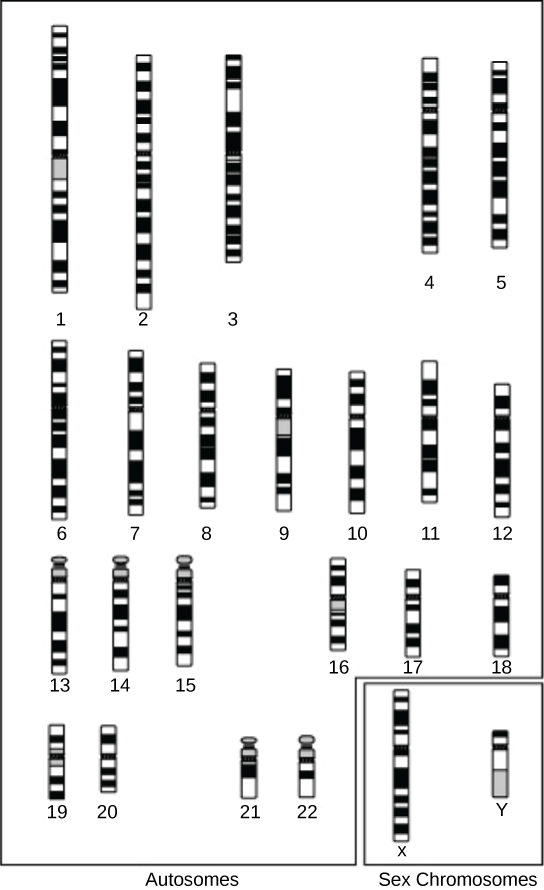
A physical map provides detail of the actual physical distance between genetic markers, as well as the number of nucleotides. There are three methods used to create a physical map: cytogenetic mapping, radiation hybrid mapping, and sequence mapping. Cytogenetic mapping uses information obtained by microscopic analysis of stained sections of the chromosome ( [link] ). It is possible to determine the approximate distance between genetic markers using cytogenetic mapping, but not the exact distance (number of base pairs). Radiation hybrid mapping uses radiation, such as x-rays, to break the DNA into fragments. The amount of radiation can be adjusted to create smaller or larger fragments. This technique overcomes the limitation of genetic mapping and is not affected by increased or decreased recombination frequency. Sequence mapping resulted from DNA sequencing technology that allowed for the creation of detailed physical maps with distances measured in terms of the number of base pairs. The creation of genomic libraries and complementary DNA (cDNA) libraries (collections of cloned sequences or all DNA from a genome) has sped up the process of physical mapping. A genetic site used to generate a physical map with sequencing technology (a sequence-tagged site, or STS) is a unique sequence in the genome with a known exact chromosomal location. An expressed sequence tag (EST) and a single sequence length polymorphism (SSLP) are common STSs. An EST is a short STS that is identified with cDNA libraries, while SSLPs are obtained from known genetic markers and provide a link between genetic maps and physical maps.

Genetic maps provide the outline and physical maps provide the details. It is easy to understand why both types of genome mapping techniques are important to show the big picture. Information obtained from each technique is used in combination to study the genome. Genomic mapping is being used with different model organisms that are used for research. Genome mapping is still an ongoing process, and as more advanced techniques are developed, more advances are expected. Genome mapping is similar to completing a complicated puzzle using every piece of available data. Mapping information generated in laboratories all over the world is entered into central databases, such as GenBank at the National Center for Biotechnology Information (NCBI). Efforts are being made to make the information more easily accessible to researchers and the general public. Just as we use global positioning systems instead of paper maps to navigate through roadways, NCBI has created a genome viewer tool to simplify the data-mining process.
Problem statement: Do the human, macaque, and mouse genomes contain common DNA sequences?
Develop a hypothesis.
To test the hypothesis, click this link .
In Search box on the left panel, type any gene name or phenotypic characteristic, such as iris pigmentation (eye color). Select the species you want to study, and then press Enter. The genome map viewer will indicate which chromosome encodes the gene in your search. Click each hit in the genome viewer for more detailed information. This type of search is the most basic use of the genome viewer; it can also be used to compare sequences between species, as well as many other complicated tasks.
Is the hypothesis correct? Why or why not?
Online Mendelian Inheritance in Man (OMIM) is a searchable online catalog of human genes and genetic disorders. This website shows genome mapping information, and also details the history and research of each trait and disorder. Click this link to search for traits (such as handedness) and genetic disorders (such as diabetes).
Genome mapping is similar to solving a big, complicated puzzle with pieces of information coming from laboratories all over the world. Genetic maps provide an outline for the location of genes within a genome, and they estimate the distance between genes and genetic markers on the basis of recombination frequencies during meiosis. Physical maps provide detailed information about the physical distance between the genes. The most detailed information is available through sequence mapping. Information from all mapping and sequencing sources is combined to study an entire genome.

Notification Switch
Would you like to follow the 'Biology' conversation and receive update notifications?