| << Chapter < Page | Chapter >> Page > |
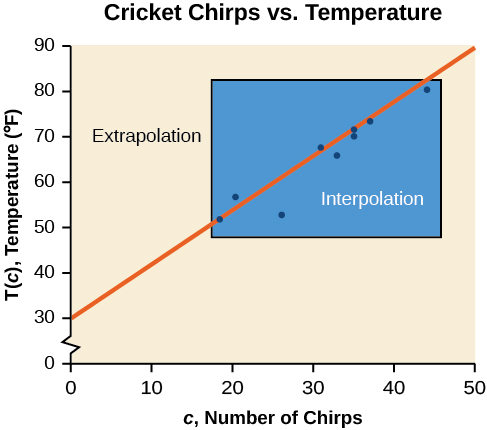
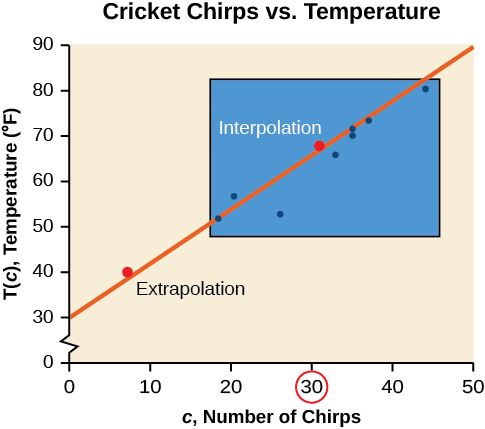
[link] compares the two processes for the cricket-chirp data addressed in [link] . We can see that interpolation would occur if we used our model to predict temperature when the values for chirps are between 18.5 and 44. Extrapolation would occur if we used our model to predict temperature when the values for chirps are less than 18.5 or greater than 44.
There is a difference between making predictions inside the domain and range of values for which we have data and outside that domain and range. Predicting a value outside of the domain and range has its limitations. When our model no longer applies after a certain point, it is sometimes called model breakdown . For example, predicting a cost function for a period of two years may involve examining the data where the input is the time in years and the output is the cost. But if we try to extrapolate a cost when that is in 50 years, the model would not apply because we could not account for factors fifty years in the future.

Different methods of making predictions are used to analyze data.
The method of
interpolation involves predicting a value inside the domain and/or range of the data.
The method of
extrapolation involves predicting a value outside the domain and/or range of the data.
Model breakdown occurs at the point when the model no longer applies.
Use the cricket data from [link] to answer the following questions:
Based on the data we have, this value seems reasonable.
We can compare the regions of interpolation and extrapolation using [link] .

According to the data from [link] , what temperature can we predict it is if we counted 20 chirps in 15 seconds?
While eyeballing a line works reasonably well, there are statistical techniques for fitting a line to data that minimize the differences between the line and data values Technically, the method minimizes the sum of the squared differences in the vertical direction between the line and the data values. . One such technique is called least squares regression and can be computed by many graphing calculators, spreadsheet software, statistical software, and many web-based calculators For example, http://www.shodor.org/unchem/math/lls/leastsq.html . Least squares regression is one means to determine the line that best fits the data, and here we will refer to this method as linear regression.

Notification Switch
Would you like to follow the 'College algebra' conversation and receive update notifications?