| << Chapter < Page | Chapter >> Page > |

We all know that a flat mirror enables us to see an accurate image of ourselves and whatever is behind us. When we tilt the mirror, the images we see may shift horizontally or vertically. But what happens when we bend a flexible mirror? Like a carnival funhouse mirror, it presents us with a distorted image of ourselves, stretched or compressed horizontally or vertically. In a similar way, we can distort or transform mathematical functions to better adapt them to describing objects or processes in the real world. In this section, we will take a look at several kinds of transformations.
Often when given a problem, we try to model the scenario using mathematics in the form of words, tables, graphs, and equations. One method we can employ is to adapt the basic graphs of the toolkit functions to build new models for a given scenario. There are systematic ways to alter functions to construct appropriate models for the problems we are trying to solve.
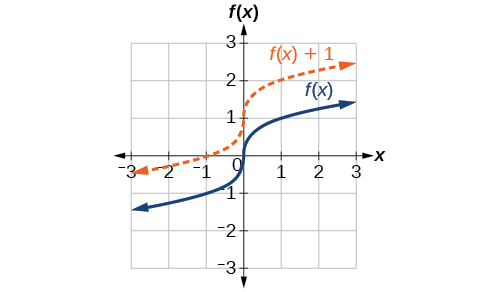
One simple kind of transformation involves shifting the entire graph of a function up, down, right, or left. The simplest shift is a vertical shift , moving the graph up or down, because this transformation involves adding a positive or negative constant to the function. In other words, we add the same constant to the output value of the function regardless of the input. For a function the function is shifted vertically units. See [link] for an example.

To help you visualize the concept of a vertical shift, consider that Therefore, is equivalent to Every unit of is replaced by so the y -value increases or decreases depending on the value of The result is a shift upward or downward.
Given a function a new function where is a constant, is a vertical shift of the function All the output values change by units. If is positive, the graph will shift up. If is negative, the graph will shift down.
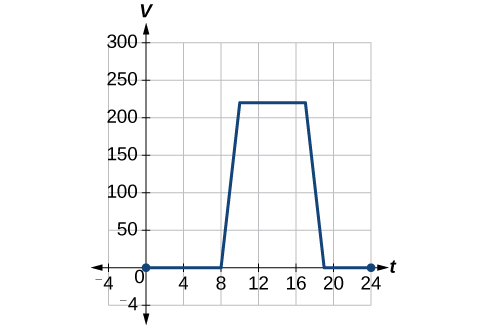
To regulate temperature in a green building, airflow vents near the roof open and close throughout the day. [link] shows the area of open vents (in square feet) throughout the day in hours after midnight, During the summer, the facilities manager decides to try to better regulate temperature by increasing the amount of open vents by 20 square feet throughout the day and night. Sketch a graph of this new function.

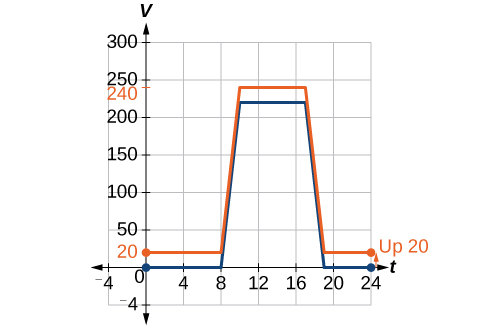
We can sketch a graph of this new function by adding 20 to each of the output values of the original function. This will have the effect of shifting the graph vertically up, as shown in [link] .

Notice that in [link] , for each input value, the output value has increased by 20, so if we call the new function we could write
This notation tells us that, for any value of can be found by evaluating the function at the same input and then adding 20 to the result. This defines as a transformation of the function in this case a vertical shift up 20 units. Notice that, with a vertical shift, the input values stay the same and only the output values change. See [link] .
| 0 | 8 | 10 | 17 | 19 | 24 | |
| 0 | 0 | 220 | 220 | 0 | 0 | |
| 20 | 20 | 240 | 240 | 20 | 20 |

Notification Switch
Would you like to follow the 'Algebra and trigonometry' conversation and receive update notifications?