<< Chapter < Page Chapter >> Page >

Consider the following data set:

  • 4
  • 5
  • 6
  • 6
  • 6
  • 7
  • 7
  • 7
  • 7
  • 7
  • 7
  • 8
  • 8
  • 8
  • 9
  • 10

This data set produces the histogram shown below. Each interval has width one and each value is located in the middle of an interval.
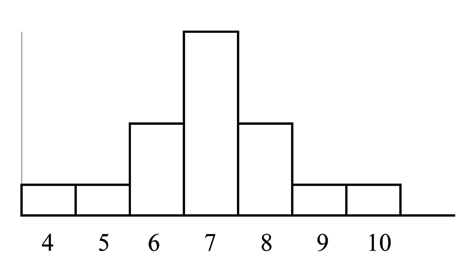
A histogram with a symmetrical data distribution, with a mean, median, and mode of 7.

The histogram displays a symmetrical distribution of data. A distribution is symmetrical if a vertical line can be drawn at some point in the histogram such that the shape to the left and the right of the vertical line are mirror images of each other. The mean, the median, and the mode are each 7 for these data. In a perfectly symmetrical distribution, the mean and the median are the same. This example has one mode (unimodal) and the mode is the same as the mean and median. In a symmetrical distribution that has two modes (bimodal), the two modes would be different from the mean and median.

The histogram for the data:

  • 4
  • 5
  • 6
  • 6
  • 6
  • 7
  • 7
  • 7
  • 7
  • 8

is not symmetrical. The right-hand side seems "chopped off" compared to the left side. The shape distribution is called skewed to the left because it is pulled out to the left.
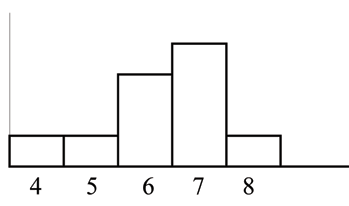
A histogram that is skewed to the left.  The mode is still 7, but the mean and median are less than 7.

The mean is 6.3, the median is 6.5, and the mode is 7. Notice that the mean is less than the median and they are both less than the mode. The mean and the median both reflect the skewing but the mean more so.

The histogram for the data:

  • 6
  • 7
  • 7
  • 7
  • 7
  • 8
  • 8
  • 8
  • 9
  • 10

is also not symmetrical. It is skewed to the right .
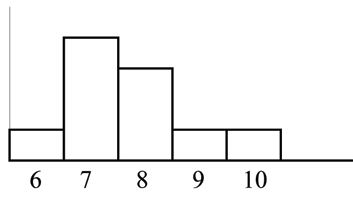
A histogram skewed to the right.  The mode is still 7, but the mean and median are both greater than 7.

The mean is 7.7, the median is 7.5, and the mode is 7. Of the three statistics, the mean is the largest, while the mode is the smallest . Again, the mean reflects the skewing the most.

To summarize, generally if the distribution of data is skewed to the left, the mean is less than the median, which is often less than the mode. If the distribution of data is skewed to the right, the mode is often less than the median, which is less than the mean.

Skewness and symmetry become important when we discuss probability distributions in later chapters.

Questions & Answers

profit maximize for monopolistically?
Usman Reply
what kind of demand curve under monopoly?
Mik Reply
what is the difference between inflation and scarcity ?
Abdu Reply
What stops oligopolists from acting together as a monopolist and earning the highest possible level of profits?
Mik
why economics is difficult for 2nd school students.
Siraj Reply
what does mean opportunity cost?
Aster Reply
what is poetive effect of population growth
Solomon Reply
what is inflation
Nasir Reply
what is demand
Eleni
what is economics
IMLAN Reply
economics theory describes individual behavior as the result of a process of optimization under constraints the objective to be reached being determined by
Kalkidan
Economics is a branch of social science that deal with How to wise use of resource ,s
Kassie
need
WARKISA
Economic Needs: In economics, needs are goods or services that are necessary for maintaining a certain standard of living. This includes things like healthcare, education, and transportation.
Kalkidan
What is demand and supply
EMPEROR Reply
deman means?
Alex
what is supply?
Alex
ex play supply?
Alex
Money market is a branch or segment of financial market where short-term debt instruments are traded upon. The instruments in this market includes Treasury bills, Bonds, Commercial Papers, Call money among other.
murana Reply
good
Kayode
what is money market
umar Reply
Examine the distinction between theory of comparative cost Advantage and theory of factor proportion
Fatima Reply
What is inflation
Bright Reply
a general and ongoing rise in the level of prices in an economy
AI-Robot
What are the factors that affect demand for a commodity
Florence Reply
price
Kenu
differentiate between demand and supply giving examples
Lambiv Reply
differentiated between demand and supply using examples
Lambiv
what is labour ?
Lambiv
Got questions? Join the online conversation and get instant answers!
Jobilize.com Reply

Get Jobilize Job Search Mobile App in your pocket Now!

Get it on Google Play Download on the App Store Now


Source:  OpenStax, Collaborative statistics-parzen remix. OpenStax CNX. Jul 15, 2009 Download for free at http://legacy.cnx.org/content/col10732/1.2
Google Play and the Google Play logo are trademarks of Google Inc.

Notification Switch

Would you like to follow the 'Collaborative statistics-parzen remix' conversation and receive update notifications?

Ask