<< Chapter < Page Chapter >> Page >
  1. The two independent samples are simple random samples from two distinct populations.
  2. For the two distinct populations:
    • if the sample sizes are small, the distributions are important (should be normal)
    • if the sample sizes are large, the distributions are not important (need not be normal)

The test comparing two independent population means with unknown and possibly unequal population standard deviations is called the Aspin-Welch t-test. The degrees of freedom formula was developed by Aspin-Welch.

The comparison of two population means is very common. A difference between the two samples depends on both the means and the standard deviations. Very different means can occur by chance if there is great variation among the individual samples. In order to account for the variation, we take the difference of the sample means, X ¯ 1 X ¯ 2 , and divide by the standard error in order to standardize the difference. The result is a t-score test statistic.

Because we do not know the population standard deviations, we estimate them using the two sample standard deviations from our independent samples. For the hypothesis test, we calculate the estimated standard deviation, or standard error , of the difference in sample means , X ¯ 1 X ¯ 2 .

The standard error is:

( s 1 ) 2 n 1 + ( s 2 ) 2 n 2

The test statistic ( t -score) is calculated as follows:

( x ¯ 1 x ¯ 2 ) ( μ 1 μ 2 ) ( s 1 ) 2 n 1 + ( s 2 ) 2 n 2

    Where:

  • s 1 and s 2 , the sample standard deviations, are estimates of σ 1 and σ 2 , respectively.
  • σ 1 and σ 1 are the unknown population standard deviations.
  • x ¯ 1 and x ¯ 2 are the sample means. μ 1 and μ 2 are the population means.

The number of degrees of freedom ( df ) requires a somewhat complicated calculation. However, a computer or calculator calculates it easily. The df are not always a whole number. The test statistic calculated previously is approximated by the Student's t -distribution with df as follows:

Degrees of freedom

d f = ( ( s 1 ) 2 n 1 + ( s 2 ) 2 n 2 ) 2 ( 1 n 1 1 ) ( ( s 1 ) 2 n 1 ) 2 + ( 1 n 2 1 ) ( ( s 2 ) 2 n 2 ) 2

When both sample sizes n 1 and n 2 are five or larger, the Student's t approximation is very good. Notice that the sample variances ( s 1 ) 2 and ( s 2 ) 2 are not pooled. (If the question comes up, do not pool the variances.)

It is not necessary to compute this by hand. A calculator or computer easily computes it.

Independent groups

The average amount of time boys and girls aged seven to 11 spend playing sports each day is believed to be the same. A study is done and data are collected, resulting in the data in [link] . Each populations has a normal distribution.

Sample Size Average Number of Hours Playing Sports Per Day Sample Standard Deviation
Girls 9 2 0.866
Boys 16 3.2 1.00

Is there a difference in the mean amount of time boys and girls aged seven to 11 play sports each day? Test at the 5% level of significance.

The population standard deviations are not known. Let g be the subscript for girls and b be the subscript for boys. Then, μ g is the population mean for girls and μ b is the population mean for boys. This is a test of two independent groups , two population means .

Random variable : X ¯ g X ¯ b = difference in the sample mean amount of time girls and boys play sports each day.
H 0 : μ g = μ b    H 0 : μ g μ b = 0
H a : μ g μ b    H a : μ g μ b ≠ 0
The words "the same" tell you H 0 has an "=". Since there are no other words to indicate H a , assume it says "is different." This is a two-tailed test.

Distribution for the test: Use t df where df is calculated using the df formula for independent groups, two population means. Using a calculator, df is approximately 18.8462. Do not pool the variances.

Calculate the p -value using a Student's t -distribution: p -value = 0.0054

Graph:
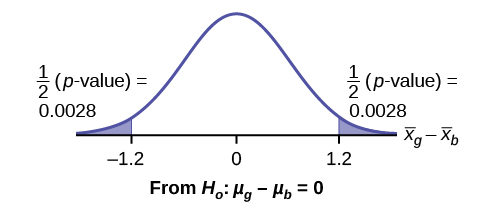
This is a normal distribution curve representing the difference in the average amount of time girls and boys play sports all day. The mean is equal to zero, and the values -1.2, 0, and 1.2 are labeled on the horizontal axis. Two vertical lines extend from -1.2 and 1.2 to the curve. The region to the left of x = -1.2 and the region to the right of x = 1.2 are shaded to represent the p-value. The area of each region is 0.0028.


s g = 0.866
s b = 1
So, x ¯ g x ¯ b = 2 – 3.2 = –1.2
Half the p -value is below –1.2 and half is above 1.2.

Make a decision: Since α > p -value, reject H 0 . This means you reject μ g = μ b . The means are different.

Press STAT . Arrow over to TESTS and press 4:2-SampTTest . Arrow over to Stats and press ENTER . Arrow down and enter 2 for the first sample mean, 0.866 for Sx1, 9 for n1, 3.2 for the second sample mean, 1 for Sx2, and 16 for n2. Arrow down to μ1: and arrow to does not equal μ2. Press ENTER . Arrow down to Pooled: and No . Press ENTER . Arrow down to Calculate and press ENTER . The p -value is p = 0.0054, the dfs are approximately 18.8462, and the test statistic is -3.14. Do the procedure again but instead of Calculate do Draw.

Conclusion: At the 5% level of significance, the sample data show there is sufficient evidence to conclude that the mean number of hours that girls and boys aged seven to 11 play sports per day is different (mean number of hours boys aged seven to 11 play sports per day is greater than the mean number of hours played by girls OR the mean number of hours girls aged seven to 11 play sports per day is greater than the mean number of hours played by boys).

Got questions? Get instant answers now!

Questions & Answers

how to create a software using Android phone
Wiseman Reply
how
basra
what is the difference between C and C++.
Yan Reply
what is software
Sami Reply
software is a instructions like programs
Shambhu
what is the difference between C and C++.
Yan
yes, how?
Hayder
what is software engineering
Ahmad
software engineering is a the branch of computer science deals with the design,development, testing and maintenance of software applications.
Hayder
who is best bw software engineering and cyber security
Ahmad
Both software engineering and cybersecurity offer exciting career prospects, but your choice ultimately depends on your interests and skills. If you enjoy problem-solving, programming, and designing software syste
Hayder
what's software processes
Ntege Reply
I haven't started reading yet. by device (hardware) or for improving design Lol? Here. Requirement, Design, Implementation, Verification, Maintenance.
Vernon
I can give you a more valid answer by 5:00 By the way gm.
Vernon
it is all about designing,developing, testing, implementing and maintaining of software systems.
Ehenew
hello assalamualaikum
Sami
My name M Sami I m 2nd year student
Sami
what is the specific IDE for flutter programs?
Mwami Reply
jegudgdtgd my Name my Name is M and I have been talking about iey my papa john's university of washington post I tagged I will be in
Mwaqas Reply
yes
usman
how disign photo
atul Reply
hlo
Navya
hi
Michael
yes
Subhan
Show the necessary steps with description in resource monitoring process (CPU,memory,disk and network)
samuel Reply
What is software engineering
Tafadzwa Reply
Software engineering is a branch of computer science directed to writing programs to develop Softwares that can drive or enable the functionality of some hardwares like phone , automobile and others
kelvin
if any requirement engineer is gathering requirements from client and after getting he/she Analyze them this process is called
Alqa Reply
The following text is encoded in base 64. Ik5ldmVyIHRydXN0IGEgY29tcHV0ZXIgeW91IGNhbid0IHRocm93IG91dCBhIHdpbmRvdyIgLSBTdGV2ZSBXb3puaWFr Decode it, and paste the decoded text here
Julian Reply
what to do you mean
Vincent
hello
ALI
how are you ?
ALI
What is the command to list the contents of a directory in Unix and Unix-like operating systems
George Reply
how can i make my own software free of cost
Faizan Reply
like how
usman
hi
Hayder
The name of the author of our software engineering book is Ian Sommerville.
Doha Reply
what is software
Sampson Reply
the set of intruction given to the computer to perform a task
Noor
Got questions? Join the online conversation and get instant answers!
Jobilize.com Reply

Get Jobilize Job Search Mobile App in your pocket Now!

Get it on Google Play Download on the App Store Now


Source:  OpenStax, Introductory statistics. OpenStax CNX. May 06, 2016 Download for free at http://legacy.cnx.org/content/col11562/1.18
Google Play and the Google Play logo are trademarks of Google Inc.

Notification Switch

Would you like to follow the 'Introductory statistics' conversation and receive update notifications?

Ask