| << Chapter < Page | Chapter >> Page > |

A precedent for universal access to education in the United States was set with the 1972 U.S. District Court for the District of Columbia’s decision in Mills v. Board of Education of the District of Columbia . This case was brought on the behalf of seven school-age children with special needs who argued that the school board was denying their access to free public education. The school board maintained that the children’s “exceptional” needs, which included mental retardation and mental illness, precluded their right to be educated for free in a public school setting. The board argued that the cost of educating these children would be too expensive and that the children would therefore have to remain at home without access to education.
This case was resolved in a hearing without any trial. The judge, Joseph Cornelius Waddy, upheld the students’ right to education, finding that they were to be given either public education services or private education paid for by the Washington, D.C., board of education. He noted that
Constitutional rights must be afforded citizens despite the greater expense involved … the District of Columbia’s interest in educating the excluded children clearly must outweigh its interest in preserving its financial resources. … The inadequacies of the District of Columbia Public School System whether occasioned by insufficient funding or administrative inefficiency, certainly cannot be permitted to bear more heavily on the “exceptional” or handicapped child than on the normal child ( Mills v. Board of Education 1972).
Today, the optimal way to include differently abled students in standard classrooms is still being researched and debated. “Inclusion” is a method that involves complete immersion in a standard classroom, whereas “mainstreaming” balances time in a special-needs classroom with standard classroom participation. There continues to be social debate surrounding how to implement the ideal of universal access to education.
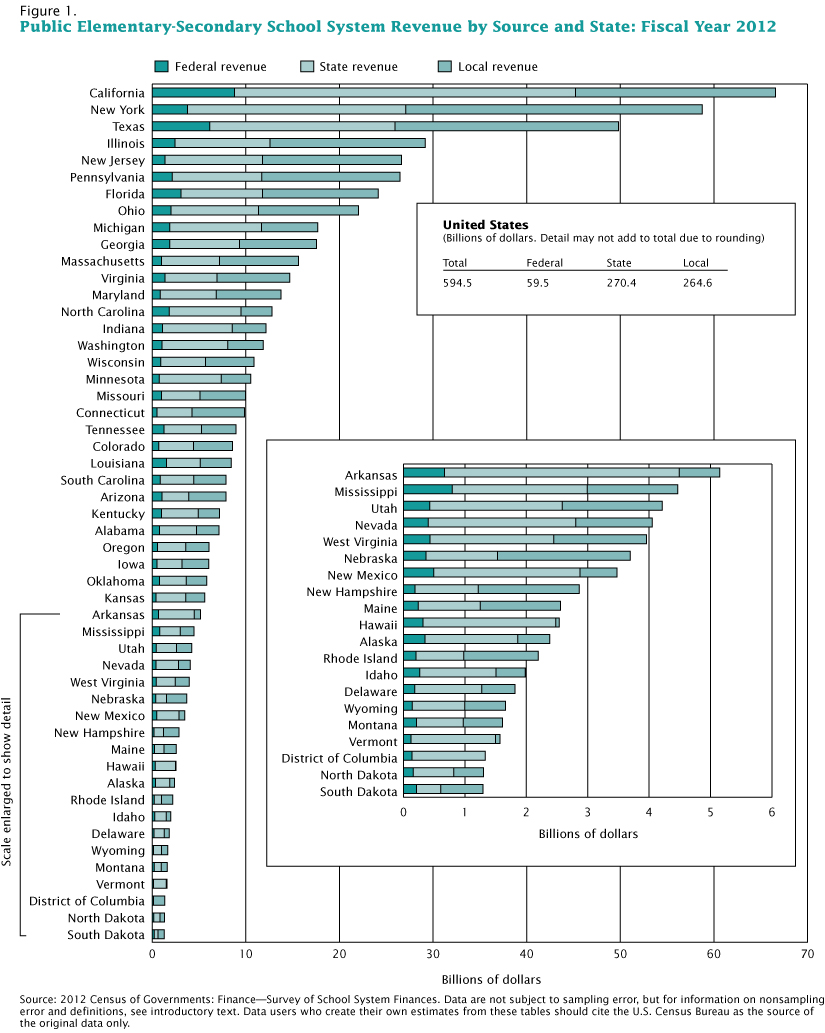
Educational systems around the world have many differences, though the same factors—including resources and money—affect every educational system. Educational distribution is a major issue in many nations, including in the United States, where the amount of money spent per student varies greatly by state. Education happens through both formal and informal systems; both foster cultural transmission. Universal access to education is a worldwide concern.
Has there ever been a time when your formal and informal educations in the same setting were at odds? How did you overcome that disconnect?
Do you believe free access to schools has achieved its intended goal? Explain.
Though it’s a struggle, education is continually being improved in the developing world. To learn how educational programs are being fostered worldwide, explore the Education section of the Center for Global Development’s website: (External Link)
Darling-Hammond, Linda. 2010. "What We Can Learn from Finland's Successful School Reform." NEA Today Magazine. Retrieved December 12, 2014. ( (External Link) )..
Durkheim, Emile. 1898 [1956]. Education and Sociology . New York: Free Press.
Gross-Loh, Christine. 2014. "Finnish Education Chief: 'We Created a School System Based on Equality.'" The Atlantic. Retrieved December 12, 2014. ( (External Link) ).
Mills v. Board of Education , 348 DC 866 (1972).
National Center for Public Policy and Higher Education. 2006. Measuring UP: The National Report Card on Higher Education . Retrieved December 9, 2011 ( (External Link) ).
National Public Radio. 2010. “Study Confirms U.S. Falling Behind in Education.” All Things Considered , December 10. Retrieved December 9, 2011 ( (External Link) ).
Pellissier, Hank. 2010. “High Test Scores, Higher Expectations, and Presidential Hype.” Great Schools . Retrieved January 17, 2012 ( (External Link) ).
Rampell, Catherine. 2009. “Of All States, New York’s Schools Spend Most Money Per Pupil.” Economix . Retrieved December 15, 2011 ( (External Link) ).
U.S. Census Bureau. 2014. "Public Education Finances 2012." Retrieved December 12, 2014. ( (External Link) ).
World Bank. 2011. “Education in Afghanistan.” Retrieved December 14, 2011 ( (External Link) ).

Notification Switch
Would you like to follow the 'Introduction to sociology 2e' conversation and receive update notifications?