<< Chapter < Page Chapter >> Page >

Access this online resource for additional instruction and practice with rates of change.

Key equations

Average rate of change Δ y Δ x = f ( x 2 ) f ( x 1 ) x 2 x 1

Key concepts

  • A rate of change relates a change in an output quantity to a change in an input quantity. The average rate of change is determined using only the beginning and ending data. See [link] .
  • Identifying points that mark the interval on a graph can be used to find the average rate of change. See [link] .
  • Comparing pairs of input and output values in a table can also be used to find the average rate of change. See [link] .
  • An average rate of change can also be computed by determining the function values at the endpoints of an interval described by a formula. See [link] and [link] .
  • The average rate of change can sometimes be determined as an expression. See [link] .
  • A function is increasing where its rate of change is positive and decreasing where its rate of change is negative. See [link] .
  • A local maximum is where a function changes from increasing to decreasing and has an output value larger (more positive or less negative) than output values at neighboring input values.
  • A local minimum is where the function changes from decreasing to increasing (as the input increases) and has an output value smaller (more negative or less positive) than output values at neighboring input values.
  • Minima and maxima are also called extrema.
  • We can find local extrema from a graph. See [link] and [link] .
  • The highest and lowest points on a graph indicate the maxima and minima. See [link] .

Section exercises

Verbal

Can the average rate of change of a function be constant?

Yes, the average rate of change of all linear functions is constant.

Got questions? Get instant answers now!

If a function f is increasing on ( a , b ) and decreasing on ( b , c ) , then what can be said about the local extremum of f on ( a , c ) ?

Got questions? Get instant answers now!

How are the absolute maximum and minimum similar to and different from the local extrema?

The absolute maximum and minimum relate to the entire graph, whereas the local extrema relate only to a specific region around an open interval.

Got questions? Get instant answers now!

How does the graph of the absolute value function compare to the graph of the quadratic function, y = x 2 , in terms of increasing and decreasing intervals?

Got questions? Get instant answers now!

Algebraic

For the following exercises, find the average rate of change of each function on the interval specified for real numbers b or h .

f ( x ) = 4 x 2 7 on [ 1 ,   b ]

4 ( b + 1 )

Got questions? Get instant answers now!

g ( x ) = 2 x 2 9 on [ 4 ,   b ]

Got questions? Get instant answers now!

p ( x ) = 3 x + 4 on [ 2 ,   2 + h ]

3

Got questions? Get instant answers now!

k ( x ) = 4 x 2 on [ 3 ,   3 + h ]

Got questions? Get instant answers now!

f ( x ) = 2 x 2 + 1 on [ x , x + h ]

4 x + 2 h

Got questions? Get instant answers now!

g ( x ) = 3 x 2 2 on [ x , x + h ]

Got questions? Get instant answers now!

a ( t ) = 1 t + 4 on [ 9 , 9 + h ]

1 13 ( 13 + h )

Got questions? Get instant answers now!

b ( x ) = 1 x + 3 on [ 1 , 1 + h ]

Got questions? Get instant answers now!

j ( x ) = 3 x 3 on [ 1 , 1 + h ]

3 h 2 + 9 h + 9

Got questions? Get instant answers now!

r ( t ) = 4 t 3 on [ 2 , 2 + h ]

Got questions? Get instant answers now!

f ( x + h ) f ( x ) h given f ( x ) = 2 x 2 3 x on [ x , x + h ]

4 x + 2 h 3

Got questions? Get instant answers now!

Graphical

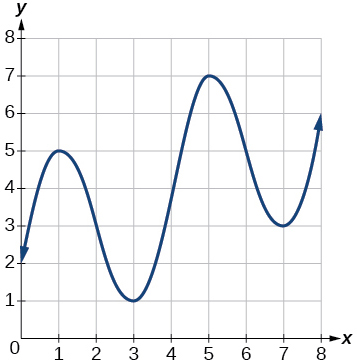
For the following exercises, consider the graph of f shown in [link] .

Graph of a polynomial.

Estimate the average rate of change from x = 1 to x = 4.

Got questions? Get instant answers now!

Estimate the average rate of change from x = 2 to x = 5.

4 3

Got questions? Get instant answers now!

For the following exercises, use the graph of each function to estimate the intervals on which the function is increasing or decreasing.

Graph of a cubic function.

increasing on ( , 2.5 ) ( 1 , ) , decreasing on ( 2.5 ,   1 )

Got questions? Get instant answers now!
Graph of a reciprocal function.

increasing on ( , 1 ) ( 3 , 4 ) , decreasing on ( 1 , 3 ) ( 4 , )

Got questions? Get instant answers now!

For the following exercises, consider the graph shown in [link] .

Practice Key Terms 9

Get Jobilize Job Search Mobile App in your pocket Now!

Get it on Google Play Download on the App Store Now


Source:  OpenStax, Precalculus. OpenStax CNX. Jan 19, 2016 Download for free at https://legacy.cnx.org/content/col11667/1.6
Google Play and the Google Play logo are trademarks of Google Inc.

Notification Switch

Would you like to follow the 'Precalculus' conversation and receive update notifications?

Ask