| << Chapter < Page | Chapter >> Page > |
Given determine the amplitude, period, phase shift, and horizontal shift. Then graph the function.
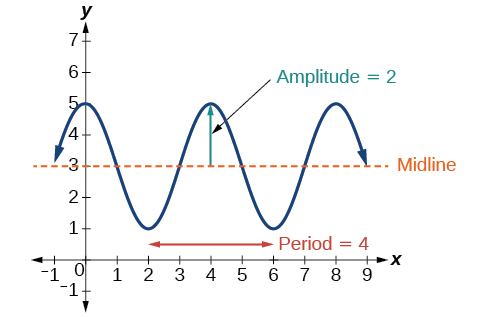
Begin by comparing the equation to the general form and use the steps outlined in [link] .
Since is negative, the graph of the cosine function has been reflected about the x -axis.
[link] shows one cycle of the graph of the function.

We can use the transformations of sine and cosine functions in numerous applications. As mentioned at the beginning of the chapter, circular motion can be modeled using either the sine or cosine function .
A point rotates around a circle of radius 3 centered at the origin. Sketch a graph of the y -coordinate of the point as a function of the angle of rotation.
Recall that, for a point on a circle of radius r , the y -coordinate of the point is so in this case, we get the equation The constant 3 causes a vertical stretch of the y -values of the function by a factor of 3, which we can see in the graph in [link] .
![A graph of 3sin(x). Graph has period of 2pi, amplitude of 3, and range of [-3,3].](/ocw/mirror/col11667/m49387/CNX_Precalc_Figure_06_01_023.jpg)
What is the amplitude of the function Sketch a graph of this function.
7
![A graph of 7cos(x). Graph has amplitude of 7, period of 2pi, and range of [-7,7].](/ocw/mirror/col11667/m49387/CNX_Precalc_Figure_06_01_024.jpg)
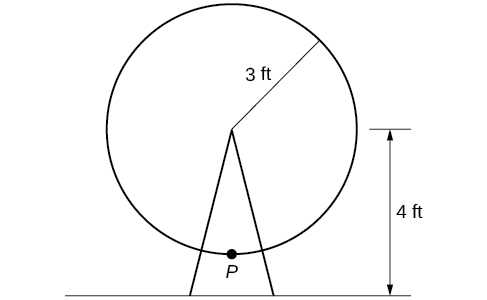
A circle with radius 3 ft is mounted with its center 4 ft off the ground. The point closest to the ground is labeled P , as shown in [link] . Sketch a graph of the height above the ground of the point as the circle is rotated; then find a function that gives the height in terms of the angle of rotation.

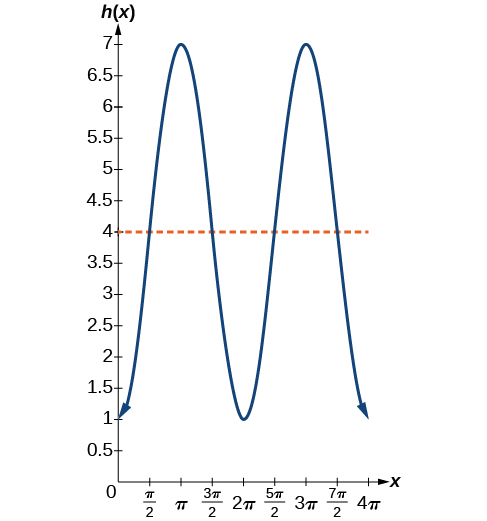
Sketching the height, we note that it will start 1 ft above the ground, then increase up to 7 ft above the ground, and continue to oscillate 3 ft above and below the center value of 4 ft, as shown in [link] .

Although we could use a transformation of either the sine or cosine function, we start by looking for characteristics that would make one function easier to use than the other. Let’s use a cosine function because it starts at the highest or lowest value, while a sine function starts at the middle value. A standard cosine starts at the highest value, and this graph starts at the lowest value, so we need to incorporate a vertical reflection.
Second, we see that the graph oscillates 3 above and below the center, while a basic cosine has an amplitude of 1, so this graph has been vertically stretched by 3, as in the last example.
Finally, to move the center of the circle up to a height of 4, the graph has been vertically shifted up by 4. Putting these transformations together, we find that
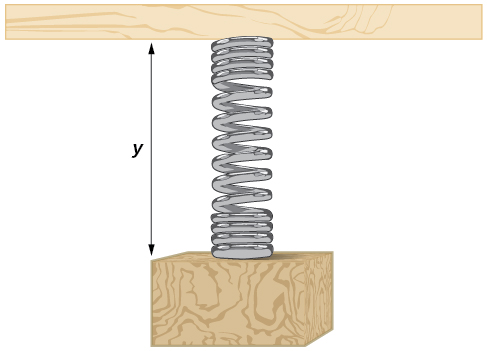
A weight is attached to a spring that is then hung from a board, as shown in [link] . As the spring oscillates up and down, the position of the weight relative to the board ranges from in. (at time to in. (at time below the board. Assume the position of is given as a sinusoidal function of Sketch a graph of the function, and then find a cosine function that gives the position in terms of

![A cosine graph with range [-1,-7]. Period is 2 pi. Local maximums at (0,-1), (2pi,-1), and (4pi, -1). Local minimums at (pi,-7) and (3pi, -7).](/ocw/mirror/col11667/m49387/CNX_Precalc_Figure_06_01_027.jpg)

Notification Switch
Would you like to follow the 'Precalculus' conversation and receive update notifications?