| << Chapter < Page | Chapter >> Page > |
Graph the hyperbola given by the standard form of an equation Identify and label the center, vertices, co-vertices, foci, and asymptotes.
center: vertices: and co-vertices: and foci: and asymptotes:

As we discussed at the beginning of this section, hyperbolas have real-world applications in many fields, such as astronomy, physics, engineering, and architecture. The design efficiency of hyperbolic cooling towers is particularly interesting. Cooling towers are used to transfer waste heat to the atmosphere and are often touted for their ability to generate power efficiently. Because of their hyperbolic form, these structures are able to withstand extreme winds while requiring less material than any other forms of their size and strength. See [link] . For example, a 500-foot tower can be made of a reinforced concrete shell only 6 or 8 inches wide!

The first hyperbolic towers were designed in 1914 and were 35 meters high. Today, the tallest cooling towers are in France, standing a remarkable 170 meters tall. In [link] we will use the design layout of a cooling tower to find a hyperbolic equation that models its sides.
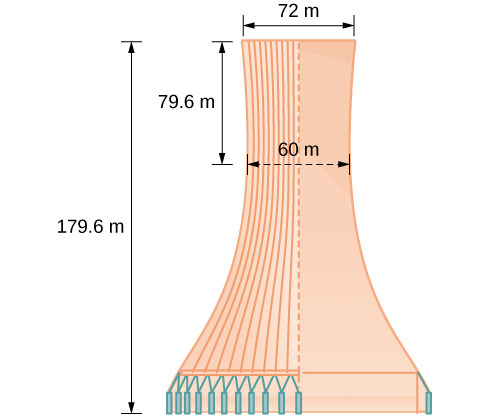
The design layout of a cooling tower is shown in [link] . The tower stands 179.6 meters tall. The diameter of the top is 72 meters. At their closest, the sides of the tower are 60 meters apart.

Find the equation of the hyperbola that models the sides of the cooling tower. Assume that the center of the hyperbola —indicated by the intersection of dashed perpendicular lines in the figure—is the origin of the coordinate plane. Round final values to four decimal places.
We are assuming the center of the tower is at the origin, so we can use the standard form of a horizontal hyperbola centered at the origin: where the branches of the hyperbola form the sides of the cooling tower. We must find the values of and to complete the model.
First, we find Recall that the length of the transverse axis of a hyperbola is This length is represented by the distance where the sides are closest, which is given as meters. So, Therefore, and
To solve for we need to substitute for and in our equation using a known point. To do this, we can use the dimensions of the tower to find some point that lies on the hyperbola. We will use the top right corner of the tower to represent that point. Since the y -axis bisects the tower, our x -value can be represented by the radius of the top, or 36 meters. The y -value is represented by the distance from the origin to the top, which is given as 79.6 meters. Therefore,
The sides of the tower can be modeled by the hyperbolic equation

Notification Switch
Would you like to follow the 'Precalculus' conversation and receive update notifications?