| << Chapter < Page | Chapter >> Page > |
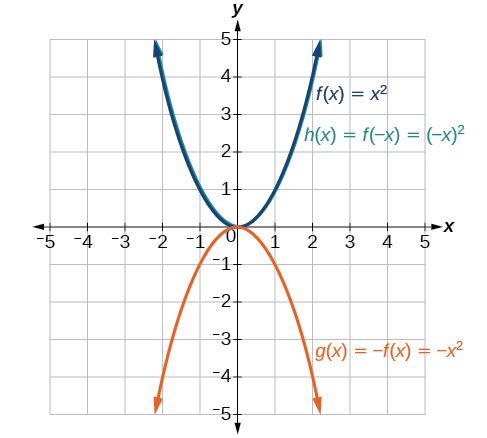
Given the toolkit function graph and Take note of any surprising behavior for these functions.

Notice: looks the same as .
Some functions exhibit symmetry so that reflections result in the original graph. For example, horizontally reflecting the toolkit functions or will result in the original graph. We say that these types of graphs are symmetric about the y -axis. Functions whose graphs are symmetric about the y -axis are called even functions.
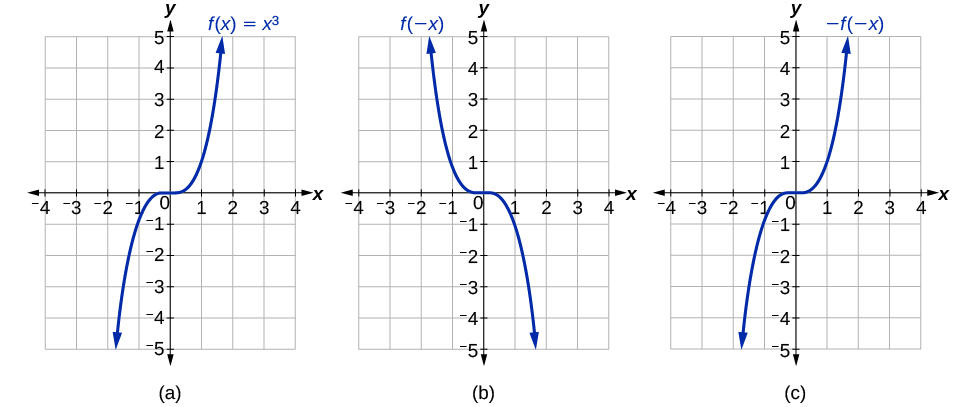
If the graphs of or were reflected over both axes, the result would be the original graph, as shown in [link] .

We say that these graphs are symmetric about the origin. A function with a graph that is symmetric about the origin is called an odd function .
Note: A function can be neither even nor odd if it does not exhibit either symmetry. For example, is neither even nor odd. Also, the only function that is both even and odd is the constant function
A function is called an even function if for every input
The graph of an even function is symmetric about the axis.
A function is called an odd function if for every input
The graph of an odd function is symmetric about the origin.
Given the formula for a function, determine if the function is even, odd, or neither.
Is the function even, odd, or neither?
Without looking at a graph, we can determine whether the function is even or odd by finding formulas for the reflections and determining if they return us to the original function. Let’s begin with the rule for even functions.
This does not return us to the original function, so this function is not even. We can now test the rule for odd functions.
Because this is an odd function.
Adding a constant to the inputs or outputs of a function changed the position of a graph with respect to the axes, but it did not affect the shape of a graph. We now explore the effects of multiplying the inputs or outputs by some quantity.
We can transform the inside (input values) of a function or we can transform the outside (output values) of a function. Each change has a specific effect that can be seen graphically.
When we multiply a function by a positive constant, we get a function whose graph is stretched or compressed vertically in relation to the graph of the original function. If the constant is greater than 1, we get a vertical stretch ; if the constant is between 0 and 1, we get a vertical compression . [link] shows a function multiplied by constant factors 2 and 0.5 and the resulting vertical stretch and compression.

Notification Switch
Would you like to follow the 'Precalculus' conversation and receive update notifications?