<< Chapter < Page Chapter >> Page >
By the end of the section, you will be able to:
  • Interpret phasor diagrams and apply them to ac circuits with resistors, capacitors, and inductors
  • Define the reactance for a resistor, capacitor, and inductor to help understand how current in the circuit behaves compared to each of these devices

In this section, we study simple models of ac voltage sources connected to three circuit components: (1) a resistor, (2) a capacitor, and (3) an inductor. The power furnished by an ac voltage source has an emf given by

v ( t ) = V 0 sin ω t ,

as shown in [link] . This sine function assumes we start recording the voltage when it is v = 0 V at a time of t = 0 s . A phase constant may be involved that shifts the function when we start measuring voltages, similar to the phase constant in the waves we studied in Waves . However, because we are free to choose when we start examining the voltage, we can ignore this phase constant for now. We can measure this voltage across the circuit components using one of two methods: (1) a quantitative approach based on our knowledge of circuits, or (2) a graphical approach that is explained in the coming sections.
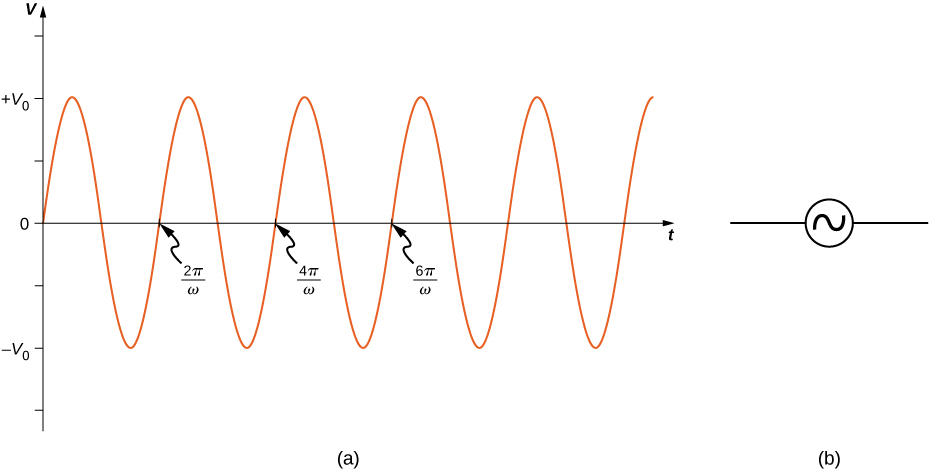
Figure shows a sine wave with maximum and minimum values of the voltage being V0 and minus V0 respectively. Each positive slope of the wave, at the x-axis, marks one complete wavelength. These points are labeled in sequence: 2 pi by omega, 4 pi by omega and 6 pi by omega.
(a) The output v ( t ) = V 0 sin ω t of an ac generator. (b) Symbol used to represent an ac voltage source in a circuit diagram.

Resistor

First, consider a resistor connected across an ac voltage source. From Kirchhoff’s loop rule, the instantaneous voltage across the resistor of [link] (a) is

v R ( t ) = V 0 sin ω t

and the instantaneous current through the resistor is
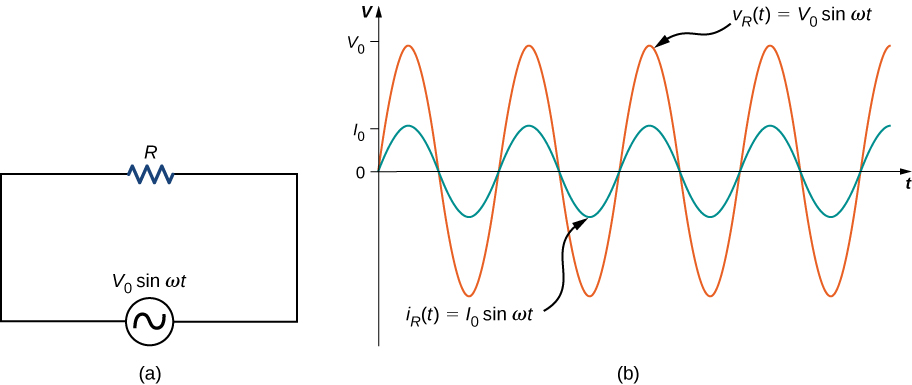
i R ( t ) = v R ( t ) R = V 0 R sin ω t = I 0 sin ω t .
Figure a shows a circuit with an AC voltage source connected to a resistor. The source is labeled V0 sine omega t. Figure b shows sine waves of AC voltage and current on the same graph. Voltage has a greater amplitude than current and its maximum value is marked V0 on the y axis. The maximum value of current is marked I0. The voltage curve is labeled V subscript R parentheses t parentheses equal to V0 sine omega t. The current curve is labeled I subscript R parentheses t parentheses equal to I0 sine omega t.
(a) A resistor connected across an ac voltage source. (b) The current i R ( t ) through the resistor and the voltage v R ( t ) across the resistor. The two quantities are in phase.

Here, I 0 = V 0 / R is the amplitude of the time-varying current. Plots of i R ( t ) and v R ( t ) are shown in [link] (b). Both curves reach their maxima and minima at the same times, that is, the current through and the voltage across the resistor are in phase.

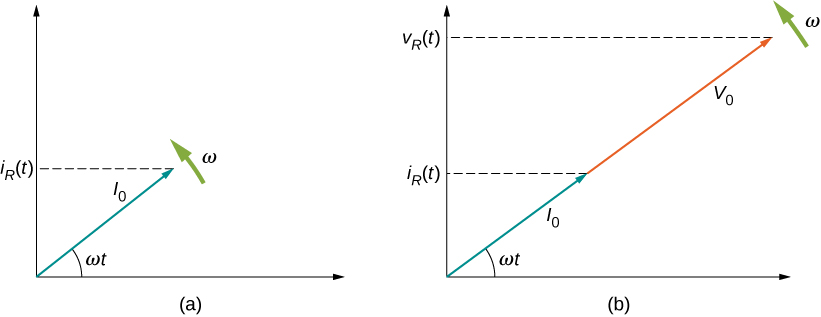
Graphical representations of the phase relationships between current and voltage are often useful in the analysis of ac circuits. Such representations are called phasor diagrams . The phasor diagram for i R ( t ) is shown in [link] (a), with the current on the vertical axis. The arrow (or phasor) is rotating counterclockwise at a constant angular frequency ω , so we are viewing it at one instant in time. If the length of the arrow corresponds to the current amplitude I 0 , the projection of the rotating arrow onto the vertical axis is i R ( t ) = I 0 sin ω t , which is the instantaneous current.

Figure shows the coordinate axes. An arrow labeled V0 starts from the origin and points up and right making an angle omega t with the x axis. An arrow labeled omega is shown near its tip, perpendicular to it, pointing up and left. The tip of the arrow V0 makes a y-intercept labeled V subscript C parentheses t parentheses. An arrow labeled I0 starts at the origin and points up and left. It is perpendicular to V0. It makes a y intercept labeled i subscript C parentheses t parentheses. A arrow labeled omega is shown near its tip, perpendicular to it, pointing down and left.
(a) The phasor diagram representing the current through the resistor of [link] . (b) The phasor diagram representing both i R ( t ) and v R ( t ) .

The vertical axis on a phasor diagram could be either the voltage or the current, depending on the phasor that is being examined. In addition, several quantities can be depicted on the same phasor diagram. For example, both the current i R ( t ) and the voltage v R ( t ) are shown in the diagram of [link] (b). Since they have the same frequency and are in phase, their phasors point in the same direction and rotate together. The relative lengths of the two phasors are arbitrary because they represent different quantities; however, the ratio of the lengths of the two phasors can be represented by the resistance, since one is a voltage phasor and the other is a current phasor.

Questions & Answers

how to create a software using Android phone
Wiseman Reply
how
basra
what is the difference between C and C++.
Yan Reply
what is software
Sami Reply
software is a instructions like programs
Shambhu
what is the difference between C and C++.
Yan
yes, how?
Hayder
what is software engineering
Ahmad
software engineering is a the branch of computer science deals with the design,development, testing and maintenance of software applications.
Hayder
who is best bw software engineering and cyber security
Ahmad
Both software engineering and cybersecurity offer exciting career prospects, but your choice ultimately depends on your interests and skills. If you enjoy problem-solving, programming, and designing software syste
Hayder
what's software processes
Ntege Reply
I haven't started reading yet. by device (hardware) or for improving design Lol? Here. Requirement, Design, Implementation, Verification, Maintenance.
Vernon
I can give you a more valid answer by 5:00 By the way gm.
Vernon
it is all about designing,developing, testing, implementing and maintaining of software systems.
Ehenew
hello assalamualaikum
Sami
My name M Sami I m 2nd year student
Sami
what is the specific IDE for flutter programs?
Mwami Reply
jegudgdtgd my Name my Name is M and I have been talking about iey my papa john's university of washington post I tagged I will be in
Mwaqas Reply
yes
usman
how disign photo
atul Reply
hlo
Navya
hi
Michael
yes
Subhan
Show the necessary steps with description in resource monitoring process (CPU,memory,disk and network)
samuel Reply
What is software engineering
Tafadzwa Reply
Software engineering is a branch of computer science directed to writing programs to develop Softwares that can drive or enable the functionality of some hardwares like phone , automobile and others
kelvin
if any requirement engineer is gathering requirements from client and after getting he/she Analyze them this process is called
Alqa Reply
The following text is encoded in base 64. Ik5ldmVyIHRydXN0IGEgY29tcHV0ZXIgeW91IGNhbid0IHRocm93IG91dCBhIHdpbmRvdyIgLSBTdGV2ZSBXb3puaWFr Decode it, and paste the decoded text here
Julian Reply
what to do you mean
Vincent
hello
ALI
how are you ?
ALI
What is the command to list the contents of a directory in Unix and Unix-like operating systems
George Reply
how can i make my own software free of cost
Faizan Reply
like how
usman
hi
Hayder
The name of the author of our software engineering book is Ian Sommerville.
Doha Reply
what is software
Sampson Reply
the set of intruction given to the computer to perform a task
Noor
Got questions? Join the online conversation and get instant answers!
Jobilize.com Reply
Practice Key Terms 4

Get Jobilize Job Search Mobile App in your pocket Now!

Get it on Google Play Download on the App Store Now


Source:  OpenStax, University physics volume 2. OpenStax CNX. Oct 06, 2016 Download for free at http://cnx.org/content/col12074/1.3
Google Play and the Google Play logo are trademarks of Google Inc.

Notification Switch

Would you like to follow the 'University physics volume 2' conversation and receive update notifications?

Ask