<< Chapter < Page Chapter >> Page >
By the end of the section, you will be able to:
  • Interpret phasor diagrams and apply them to ac circuits with resistors, capacitors, and inductors
  • Define the reactance for a resistor, capacitor, and inductor to help understand how current in the circuit behaves compared to each of these devices

In this section, we study simple models of ac voltage sources connected to three circuit components: (1) a resistor, (2) a capacitor, and (3) an inductor. The power furnished by an ac voltage source has an emf given by

v ( t ) = V 0 sin ω t ,

as shown in [link] . This sine function assumes we start recording the voltage when it is v = 0 V at a time of t = 0 s . A phase constant may be involved that shifts the function when we start measuring voltages, similar to the phase constant in the waves we studied in Waves . However, because we are free to choose when we start examining the voltage, we can ignore this phase constant for now. We can measure this voltage across the circuit components using one of two methods: (1) a quantitative approach based on our knowledge of circuits, or (2) a graphical approach that is explained in the coming sections.
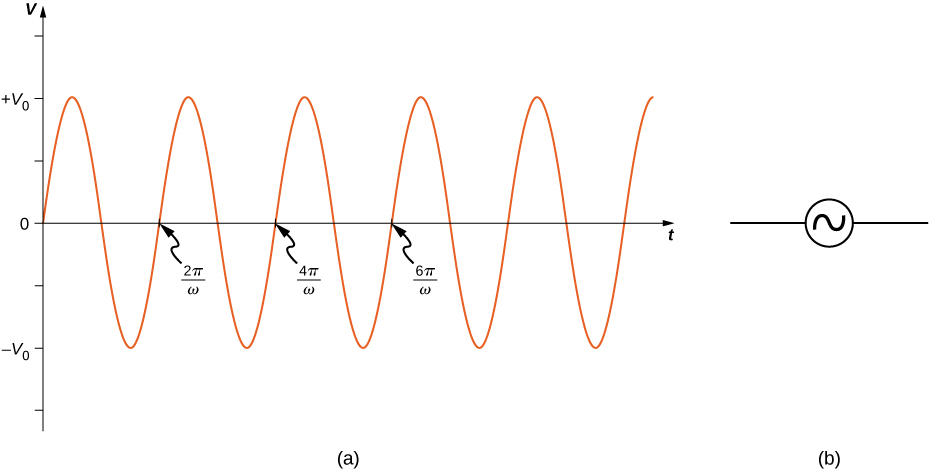
Figure shows a sine wave with maximum and minimum values of the voltage being V0 and minus V0 respectively. Each positive slope of the wave, at the x-axis, marks one complete wavelength. These points are labeled in sequence: 2 pi by omega, 4 pi by omega and 6 pi by omega.
(a) The output v ( t ) = V 0 sin ω t of an ac generator. (b) Symbol used to represent an ac voltage source in a circuit diagram.

Resistor

First, consider a resistor connected across an ac voltage source. From Kirchhoff’s loop rule, the instantaneous voltage across the resistor of [link] (a) is

v R ( t ) = V 0 sin ω t

and the instantaneous current through the resistor is
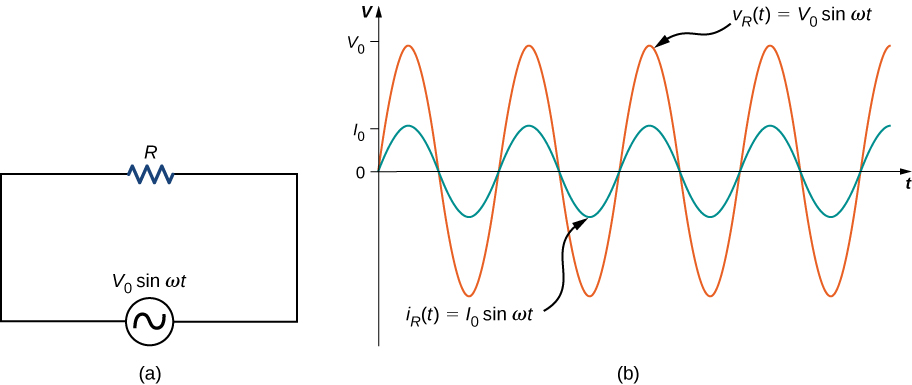
i R ( t ) = v R ( t ) R = V 0 R sin ω t = I 0 sin ω t .
Figure a shows a circuit with an AC voltage source connected to a resistor. The source is labeled V0 sine omega t. Figure b shows sine waves of AC voltage and current on the same graph. Voltage has a greater amplitude than current and its maximum value is marked V0 on the y axis. The maximum value of current is marked I0. The voltage curve is labeled V subscript R parentheses t parentheses equal to V0 sine omega t. The current curve is labeled I subscript R parentheses t parentheses equal to I0 sine omega t.
(a) A resistor connected across an ac voltage source. (b) The current i R ( t ) through the resistor and the voltage v R ( t ) across the resistor. The two quantities are in phase.

Here, I 0 = V 0 / R is the amplitude of the time-varying current. Plots of i R ( t ) and v R ( t ) are shown in [link] (b). Both curves reach their maxima and minima at the same times, that is, the current through and the voltage across the resistor are in phase.

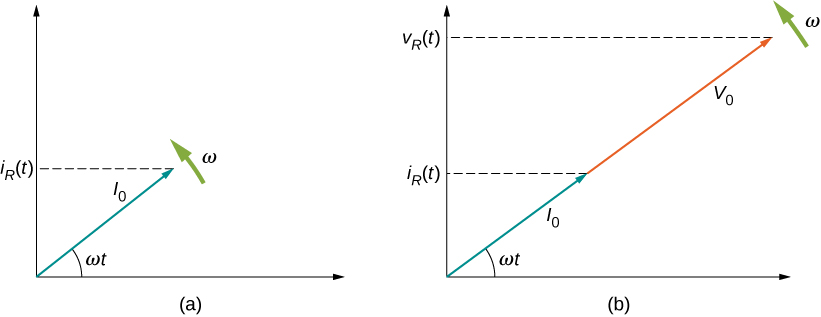
Graphical representations of the phase relationships between current and voltage are often useful in the analysis of ac circuits. Such representations are called phasor diagrams . The phasor diagram for i R ( t ) is shown in [link] (a), with the current on the vertical axis. The arrow (or phasor) is rotating counterclockwise at a constant angular frequency ω , so we are viewing it at one instant in time. If the length of the arrow corresponds to the current amplitude I 0 , the projection of the rotating arrow onto the vertical axis is i R ( t ) = I 0 sin ω t , which is the instantaneous current.

Figure shows the coordinate axes. An arrow labeled V0 starts from the origin and points up and right making an angle omega t with the x axis. An arrow labeled omega is shown near its tip, perpendicular to it, pointing up and left. The tip of the arrow V0 makes a y-intercept labeled V subscript C parentheses t parentheses. An arrow labeled I0 starts at the origin and points up and left. It is perpendicular to V0. It makes a y intercept labeled i subscript C parentheses t parentheses. A arrow labeled omega is shown near its tip, perpendicular to it, pointing down and left.
(a) The phasor diagram representing the current through the resistor of [link] . (b) The phasor diagram representing both i R ( t ) and v R ( t ) .

The vertical axis on a phasor diagram could be either the voltage or the current, depending on the phasor that is being examined. In addition, several quantities can be depicted on the same phasor diagram. For example, both the current i R ( t ) and the voltage v R ( t ) are shown in the diagram of [link] (b). Since they have the same frequency and are in phase, their phasors point in the same direction and rotate together. The relative lengths of the two phasors are arbitrary because they represent different quantities; however, the ratio of the lengths of the two phasors can be represented by the resistance, since one is a voltage phasor and the other is a current phasor.

Questions & Answers

why economics is difficult for 2nd school students.
Siraj Reply
what does mean opportunity cost?
Aster Reply
what is poetive effect of population growth
Solomon Reply
what is inflation
Nasir Reply
what is demand
Eleni
what is economics
IMLAN Reply
economics theory describes individual behavior as the result of a process of optimization under constraints the objective to be reached being determined by
Kalkidan
Economics is a branch of social science that deal with How to wise use of resource ,s
Kassie
need
WARKISA
Economic Needs: In economics, needs are goods or services that are necessary for maintaining a certain standard of living. This includes things like healthcare, education, and transportation.
Kalkidan
What is demand and supply
EMPEROR Reply
deman means?
Alex
what is supply?
Alex
ex play supply?
Alex
Money market is a branch or segment of financial market where short-term debt instruments are traded upon. The instruments in this market includes Treasury bills, Bonds, Commercial Papers, Call money among other.
murana Reply
good
Kayode
what is money market
umar Reply
Examine the distinction between theory of comparative cost Advantage and theory of factor proportion
Fatima Reply
What is inflation
Bright Reply
a general and ongoing rise in the level of prices in an economy
AI-Robot
What are the factors that affect demand for a commodity
Florence Reply
price
Kenu
differentiate between demand and supply giving examples
Lambiv Reply
differentiated between demand and supply using examples
Lambiv
what is labour ?
Lambiv
how will I do?
Venny Reply
how is the graph works?I don't fully understand
Rezat Reply
information
Eliyee
devaluation
Eliyee
t
WARKISA
hi guys good evening to all
Lambiv
multiple choice question
Aster Reply
appreciation
Eliyee
Got questions? Join the online conversation and get instant answers!
Jobilize.com Reply
Practice Key Terms 4

Get Jobilize Job Search Mobile App in your pocket Now!

Get it on Google Play Download on the App Store Now


Source:  OpenStax, University physics volume 2. OpenStax CNX. Oct 06, 2016 Download for free at http://cnx.org/content/col12074/1.3
Google Play and the Google Play logo are trademarks of Google Inc.

Notification Switch

Would you like to follow the 'University physics volume 2' conversation and receive update notifications?

Ask