| << Chapter < Page | Chapter >> Page > |
Phase transitions play an important theoretical and practical role in the study of heat flow. In melting (or “fusion”), a solid turns into a liquid; the opposite process is freezing . In evaporation , a liquid turns into a gas; the opposite process is condensation .
A substance melts or freezes at a temperature called its melting point, and boils (evaporates rapidly) or condenses at its boiling point. These temperatures depend on pressure. High pressure favors the denser form, so typically, high pressure raises the melting point and boiling point, and low pressure lowers them. For example, the boiling point of water is at 1.00 atm. At higher pressure, the boiling point is higher, and at lower pressure, it is lower. The main exception is the melting and freezing of water, discussed in the next section.
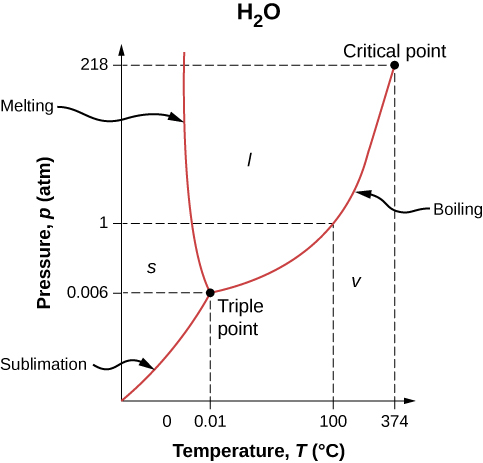
The phase of a given substance depends on the pressure and temperature. Thus, plots of pressure versus temperature showing the phase in each region provide considerable insight into thermal properties of substances. Such a pT graph is called a phase diagram .
[link] shows the phase diagram for water. Using the graph, if you know the pressure and temperature, you can determine the phase of water. The solid curves—boundaries between phases—indicate phase transitions, that is, temperatures and pressures at which the phases coexist. For example, the boiling point of water is at 1.00 atm. As the pressure increases, the boiling temperature rises gradually to at a pressure of 218 atm. A pressure cooker (or even a covered pot) cooks food faster than an open pot, because the water can exist as a liquid at temperatures greater than without all boiling away. (As we’ll see in the next section, liquid water conducts heat better than steam or hot air.) The boiling point curve ends at a certain point called the critical point —that is, a critical temperature , above which the liquid and gas phases cannot be distinguished; the substance is called a supercritical fluid . At sufficiently high pressure above the critical point, the gas has the density of a liquid but does not condense. Carbon dioxide, for example, is supercritical at all temperatures above . Critical pressure is the pressure of the critical point.

Similarly, the curve between the solid and liquid regions in [link] gives the melting temperature at various pressures. For example, the melting point is at 1.00 atm, as expected. Water has the unusual property that ice is less dense than liquid water at the melting point, so at a fixed temperature, you can change the phase from solid (ice) to liquid (water) by increasing the pressure. That is, the melting temperature of ice falls with increased pressure, as the phase diagram shows. For example, when a car is driven over snow, the increased pressure from the tires melts the snowflakes; afterwards, the water refreezes and forms an ice layer.

Notification Switch
Would you like to follow the 'University physics volume 2' conversation and receive update notifications?