| << Chapter < Page | Chapter >> Page > |
The first part of this chapter dealt with fluid statics, the study of fluids at rest. The rest of this chapter deals with fluid dynamics, the study of fluids in motion. Even the most basic forms of fluid motion can be quite complex. For this reason, we limit our investigation to ideal fluid s in many of the examples. An ideal fluid is a fluid with negligible viscosity . Viscosity is a measure of the internal friction in a fluid; we examine it in more detail in Viscosity and Turbulence . In a few examples, we examine an incompressible fluid—one for which an extremely large force is required to change the volume—since the density in an incompressible fluid is constant throughout.
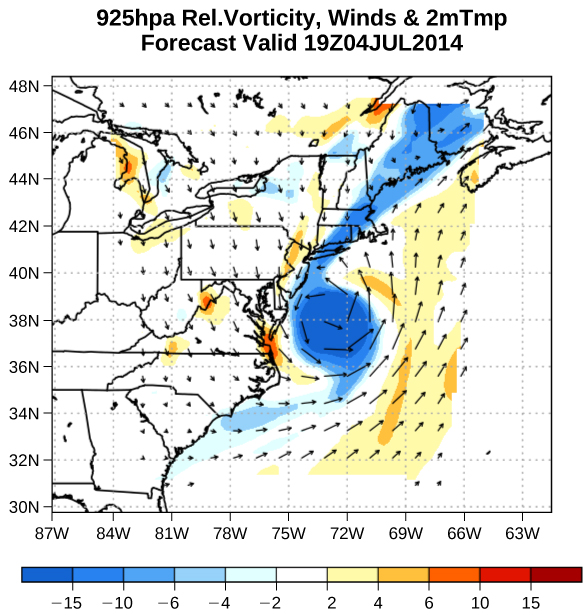
Velocity vectors are often used to illustrate fluid motion in applications like meteorology. For example, wind—the fluid motion of air in the atmosphere—can be represented by vectors indicating the speed and direction of the wind at any given point on a map. [link] shows velocity vectors describing the winds during Hurricane Arthur in 2014.

Another method for representing fluid motion is a streamline . A streamline represents the path of a small volume of fluid as it flows. The velocity is always tangential to the streamline. The diagrams in [link] use streamlines to illustrate two examples of fluids moving through a pipe. The first fluid exhibits a laminar flow (sometimes described as a steady flow), represented by smooth, parallel streamlines. Note that in the example shown in part (a), the velocity of the fluid is greatest in the center and decreases near the walls of the pipe due to the viscosity of the fluid and friction between the pipe walls and the fluid. This is a special case of laminar flow, where the friction between the pipe and the fluid is high, known as no slip boundary conditions. The second diagram represents turbulent flow , in which streamlines are irregular and change over time. In turbulent flow, the paths of the fluid flow are irregular as different parts of the fluid mix together or form small circular regions that resemble whirlpools. This can occur when the speed of the fluid reaches a certain critical speed.

The volume of fluid passing by a given location through an area during a period of time is called flow rate Q , or more precisely, volume flow rate. In symbols, this is written as

Notification Switch
Would you like to follow the 'University physics volume 1' conversation and receive update notifications?