| << Chapter < Page | Chapter >> Page > |
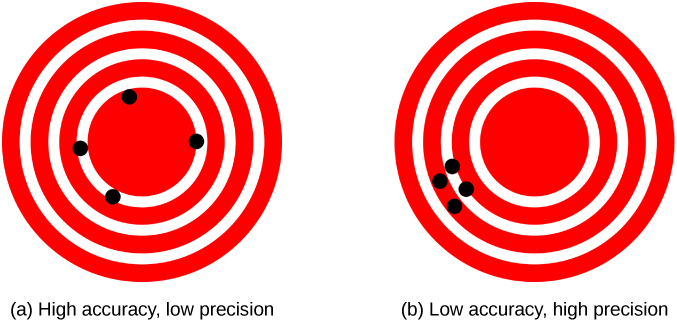
The measurements in the paper example are both accurate and precise, but in some cases, measurements are accurate but not precise, or they are precise but not accurate. Let’s consider an example of a GPS attempting to locate the position of a restaurant in a city. Think of the restaurant location as existing at the center of a bull’s-eye target and think of each GPS attempt to locate the restaurant as a black dot. In [link] (a), we see the GPS measurements are spread out far apart from each other, but they are all relatively close to the actual location of the restaurant at the center of the target. This indicates a low-precision, high-accuracy measuring system. However, in [link] (b), the GPS measurements are concentrated quite closely to one another, but they are far away from the target location. This indicates a high-precision, low-accuracy measuring system.

The precision of a measuring system is related to the uncertainty in the measurements whereas the accuracy is related to the discrepancy from the accepted reference value. Uncertainty is a quantitative measure of how much your measured values deviate from one another. There are many different methods of calculating uncertainty, each of which is appropriate to different situations. Some examples include taking the range (that is, the biggest less the smallest) or finding the standard deviation of the measurements. Discrepancy (or “measurement error”) is the difference between the measured value and a given standard or expected value. If the measurements are not very precise, then the uncertainty of the values is high. If the measurements are not very accurate, then the discrepancy of the values is high.
Recall our example of measuring paper length; we obtained measurements of 11.1 in., 11.2 in., and 10.9 in., and the accepted value was 11.0 in. We might average the three measurements to say our best guess is 11.1 in.; in this case, our discrepancy is 11.1 – 11.0 = 0.1 in., which provides a quantitative measure of accuracy. We might calculate the uncertainty in our best guess by using the range of our measured values: 0.3 in. Then we would say the length of the paper is 11.1 in. plus or minus 0.3 in. The uncertainty in a measurement, A , is often denoted as δA (read “delta A ”), so the measurement result would be recorded as A ± δA . Returning to our paper example, the measured length of the paper could be expressed as 11.1 ± 0.3 in. Since the discrepancy of 0.1 in. is less than the uncertainty of 0.3 in., we might say the measured value agrees with the accepted reference value to within experimental uncertainty.

Notification Switch
Would you like to follow the 'University physics volume 1' conversation and receive update notifications?