| << Chapter < Page | Chapter >> Page > |
Oil is a prime example of peaking. Although the peak in United States oil production was famously predicted by M. King Hubbert 20 years before it occurred, successful predictions of peaks in world oil production depend on unknown factors and are notoriously difficult ( Owen, Inderwildi,&King, 2010 ; Hirsch, Bezdek,&Wendling, 2006 ). The fundamental challenges are the unknown remaining resources at each level of recovery cost and the unknown technology breakthroughs that may lower the recovery cost. Receding Arctic ice and the growing ability to drill deeper undersea wells promise to bring more oil resources within financial and technical reach, but quantitative estimates of their impact are, at best, tentative.

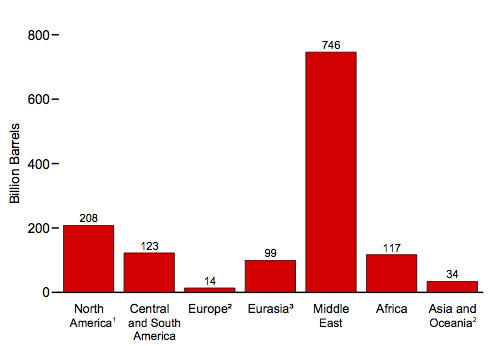
The third sustainability challenge is the uneven geographical distribution of energy resources. Figure Crude Oil Reserves shows the distribution of crude oil reserves, with the Middle East having far more oil than any other region and Europe and Asia, two high population and high demand regions, with hardly any by comparison. This geographical imbalance between energy resources and energy use creates uncertainty and instability of supply. Weather events, natural disasters, terrorist activity or geopolitical decisions can all interrupt supply, with little recourse for the affected regions. Even if global reserves were abundant, their uneven geographical distribution creates an energy security issue for much of the world.
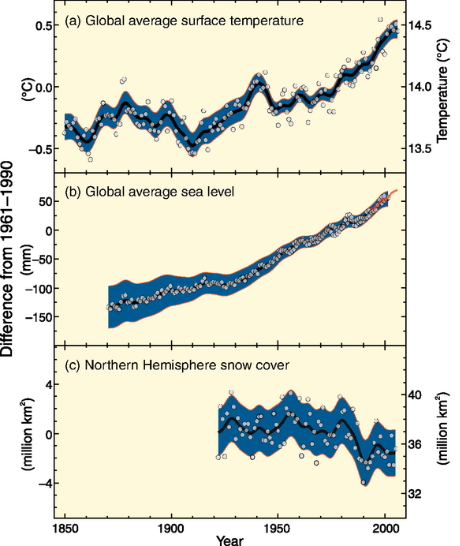
The final and most recent concern is carbon dioxide emissions and climate change (see Chapter Climate and Global Change ). Since the Intergovernmental Panel on Climate Change was established by the United Nations in 1988, awareness of the links among human carbon dioxide emissions, global warming and the potential for climate change has grown. Climate scientists worldwide have documented the evidence of global warming in surface air, land and sea temperatures, the rise of sea level, glacier ice and snow coverage, and ocean heat content ( Arndt, Baringer,&Johnson, 2010 ). Figure Temperature, Sea Level, and Snow Cover 1850-2000 shows three often quoted measures of global warming, the average surface temperature, the rise of sea level and the northern hemisphere snow cover.


Notification Switch
Would you like to follow the 'Sustainability: a comprehensive foundation' conversation and receive update notifications?