| << Chapter < Page | Chapter >> Page > |
Use the sample data to calculate the actual probability of getting the test result, called the p-value . The p-value is the probability that, if the null hypothesis is true, the results from another randomly selected sample will be as extreme or more extreme as the results obtained from the given sample.
A large p-value calculated from the data indicates that we should fail to reject the null hypothesis . The smaller the p-value, the more unlikely the outcome, and the stronger the evidence is against the null hypothesis. We would reject the null hypothesis if the evidence is strongly against it.
Draw a graph that shows the p-value. The hypothesis test is easier to perform if you use a graph because you see the problem more clearly.
Suppose a baker claims that his bread height is more than 15 cm, on the average. Several of his customers do not believe him. Topersuade his customers that he is right, the baker decides to do a hypothesis test. He bakes 10 loaves of bread. The mean height of the sample loaves is 17 cm. The bakerknows from baking hundreds of loaves of bread that the standard deviation for the height is 0.5 cm. and the distribution of heights is normal.
The null hypothesis could be : The alternate hypothesis is :
The words "is more than" translates as a " " so " " goes into the alternate hypothesis. The null hypothesis must contradict the alternate hypothesis.
Since is known ( cm.), the distribution for the population is known to be normal with mean and standard deviation .
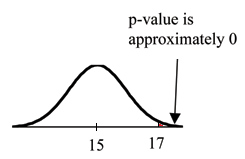
Suppose the null hypothesis is true (the mean height of the loaves is no more than 15 cm). Then is the mean height (17 cm) calculated from the sample unexpectedly large?The hypothesis test works by asking the question how unlikely the sample mean would be if the null hypothesis were true. The graph shows how far out the sample mean is onthe normal curve. The p-value is the probability that, if we were to take other samples, any other sample mean would fall at least as far out as 17 cm.
The p-value, then, is the probability that a sample mean is the same or greater than 17 cm. when the population mean is, in fact, 15 cm. We can calculate this probability using the normal distribution for means from Chapter 7.

which is approximately 0.
A p-value of approximately 0 tells us that it is highly unlikely that a loaf of bread rises no more than 15 cm, on the average. That is, almost 0% of all loaves of bread would be atleast as high as 17 cm. purely by CHANCE had the population mean height really been 15 cm. Because the outcome of 17 cm. is so unlikely (meaning it is happening NOT by chance alone) , we conclude that the evidence is strongly against the null hypothesis (the mean height is at most 15cm.). There is sufficient evidence that the true mean height for the population of the baker's loaves of bread is greater than 15 cm.

Notification Switch
Would you like to follow the 'Collaborative statistics (with edits: teegarden)' conversation and receive update notifications?