| << Chapter < Page | Chapter >> Page > |
Two samples are shown in [link] . Both have normal distributions. The means for the two populations are thought to be the same. Is there a difference in the means? Test at the 5% level of significance.
| Sample Size | Sample Mean | Sample Standard Deviation | |
|---|---|---|---|
| Population A | 25 | 5 | 1 |
| Population B | 16 | 4.7 | 1.2 |
The p -value is 0.4125, which is much higher than 0.05, so we decline to reject the null hypothesis. There is not sufficient evidence to conclude that the means of the two populations are not the same.
When the sum of the sample sizes is larger than 30 ( n 1 + n 2 >30) you can use the normal distribution to approximate the Student's t .
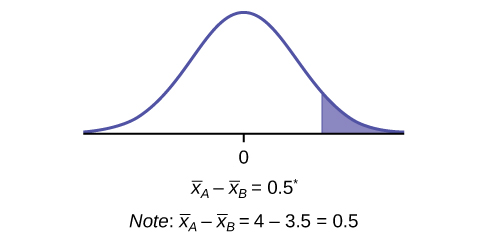
A study is done by a community group in two neighboring colleges to determine which one graduates students with more math classes. College A samples 11 graduates. Their average is four math classes with a standard deviation of 1.5 math classes. College B samples nine graduates. Their average is 3.5 math classes with a standard deviation of one math class. The community group believes that a student who graduates from college A
has taken more math classes, on the average. Both populations have a normal distribution. Test at a 1% significance level. Answer the following questions.
a. Is this a test of two means or two proportions?
a. two means
b. Are the populations standard deviations known or unknown?
b. unknown
c. Which distribution do you use to perform the test?
c. Student's
t
d. What is the random variable?
d.
e. What are the null and alternate hypotheses? Write the null and alternate hypotheses in words and in symbols.
e.
f. Is this test right-, left-, or two-tailed?
f.

right
g. What is the p -value?
g. 0.1928
h. Do you reject or not reject the null hypothesis?
h. Do not reject.
i. Conclusion:
i. At the 1% level of significance, from the sample data, there is not sufficient evidence to conclude that a student who graduates from college A has taken more math classes, on the average, than a student who graduates from college B.
A study is done to determine if Company A retains its workers longer than Company B. Company A samples 15 workers, and their average time with the company is five years with a standard deviation of 1.2. Company B samples 20 workers, and their average time with the company is 4.5 years with a standard deviation of 0.8. The populations are normally distributed.
A professor at a large community college wanted to determine whether there is a difference in the means of final exam scores between students who took his statistics course online and the students who took his face-to-face statistics class. He believed that the mean of the final exam scores for the online class would be lower than that of the face-to-face class. Was the professor correct? The randomly selected 30 final exam scores from each group are listed in [link] and [link] .

Notification Switch
Would you like to follow the 'Statistics i - math1020 - red river college - version 2015 revision a - draft 2015-10-24' conversation and receive update notifications?