<< Chapter < Page Chapter >> Page >
This module provides an overview of Comparing Two Independent Population Means with Unknown Population Standard Deviations as a part of Collaborative Statistics collection (col10522) by Barbara Illowsky and Susan Dean.
  1. The two independent samples are simple random samples from two distinct populations.
  2. Both populations are normally distributed with the population means and standard deviations unknown unless the sample sizes are greater than 30. In that case, the populations need not be normally distributed.
The test comparing two independent population means with unknown and possibly unequal population standard deviations is called the Aspin-Welch t-test. The degrees of freedom formula was developed by Aspin-Welch.

The comparison of two population means is very common. A difference between the two samples depends on both the means and the standard deviations. Verydifferent means can occur by chance if there is great variation among the individual samples. In order to account for the variation, we take the difference of the samplemeans, X 1 - X 2 , and divide by the standard error (shown below) in order to standardize the difference. The result is a t-score test statistic (shown below).

Because we do not know the population standard deviations, we estimate them using the two sample standard deviations from our independent samples. For thehypothesis test, we calculate the estimated standard deviation, or standard error , of the difference in sample means , X 1 - X 2 .

The standard error is:

( S 1 ) 2 n 1 + ( S 2 ) 2 n 2

The test statistic (t-score) is calculated as follows:

T-score

( x 1 - x 2 ) - ( μ 1 - μ 2 ) ( S 1 ) 2 n 1 + ( S 2 ) 2 n 2

    Where:

  • s 1 and s 2 , the sample standard deviations, are estimates of σ 1 and σ 2 , respectively.
  • σ 1 and σ 2 are the unknown population standard deviations.
  • x 1 and x 2 are the sample means. μ 1 and μ 2 are the population means.

The degrees of freedom (df) is a somewhat complicated calculation. However, a computer or calculator calculates it easily. The dfs are not always a whole number. The test statisticcalculated above is approximated by the student's-t distribution with dfs as follows:

Degrees of freedom

df = [ ( s 1 ) 2 n 1 + ( s 2 ) 2 n 2 ] 2 1 n 1 1 · [ ( s 1 ) 2 n 1 ] 2 + 1 n 2 1 · [ ( s 2 ) 2 n 2 ] 2

When both sample sizes n 1 and n 2 are five or larger, the student's-t approximation is very good. Notice that the sample variances s 1 2 and s 2 2 are not pooled. (If the question comes up, do not pool the variances.)

It is not necessary tocompute this by hand. A calculatoror computer easily computes it.

Independent groups

The average amount of time boys and girls ages 7 through 11 spend playing sports each day is believed to be the same. Anexperiment is done, data is collected, resulting in the table below. Both populations have a normal distribution.

Sample Size Average Number of Hours Playing Sports Per Day Sample Standard Deviation
Girls 9 2 hours 0.75
Boys 16 3.2 hours 1.00

Is there a difference in the mean amount of time boys and girls ages 7 through 11 play sports each day? Test at the 5% level of significance.

The population standard deviations are not known. Let g be the subscript for girls and b be the subscript for boys. Then, μ g is the population mean for girls and μ b is the population mean for boys. This is a test of two independent groups , two population means .

Random variable : X g - X b = difference in the sample mean amount of time girls and boys play sports each day.

H o : μ g = μ b μ g μ b = 0

H a : μ g μ b μ g μ b 0

The words "the same" tell you H o has an "=". Since there are no other words to indicate H a , then assume "is different." This is a two-tailed test.

Distribution for the test: Use t df where df is calculated using the df formula for independent groups, two population means. Using a calculator, df is approximately 18.8462. Do not pool the variances.

Calculate the p-value using a student's-t distribution: p-value = 0.0054

Graph:
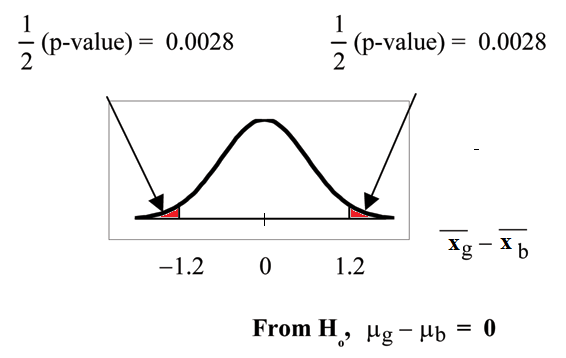
Normal distribution curve of the difference in the average amount of time girls and boys play sports all day with values of -1.2, 0, and 1.2 on the x-axis. Two vertical upward lines extend from points -1.2 and 1.2 to the curve. The 1/2(p-values) areas are indicated on either side of these values.

s g = 0.75

s b = 1

So, x g - x b = 2 - 3.2 = - 1.2

Half the p-value is below -1.2 andhalf is above 1.2.

Make a decision: Since α > p-value, reject H o .

This means you reject μ g = μ b . The means are different.

Conclusion: At the 5% level of significance, the sample data show there is sufficient evidence to conclude that the mean number of hours that girls and boys aged 7through 11 play sports per day is different (mean number of hours boys aged 7 through 11 play sports per day is greater than the mean number of hours played by girls OR the mean number of hours girls aged 7 through 11 play sports per day is greater than the mean number of hours played by boys).

TI-83+ and TI-84: Press STAT . Arrow over to TESTS and press 4:2-SampTTest . Arrow over to Stats and press ENTER . Arrow down and enter 2 for the first sample mean, 0.75 for Sx1, 9 for n1, 3.2 for the second sample mean, 1 for Sx2, and 16 for n2. Arrow down to μ1: and arrow to does not equal μ2. Press ENTER . Arrow down to Pooled: and No . Press ENTER . Arrow down to Calculate and press ENTER . The p-value is p = 0.0054, the dfs are approximately 18.8462, and the teststatistic is -3.14. Do the procedure again but instead of Calculate do Draw.

A study is done by a community group in two neighboring colleges to determine which one graduates students with more math classes. College A samples11 graduates. Their average is 4 math classes with a standard deviation of 1.5 math classes. College B samples 9 graduates. Their average is 3.5 math classes with astandard deviation of 1 math class. The community group believes that a student who graduates from college A has taken more math classes, on the average. Both populations have a normal distribution. Test at a 1% significance level.Answer the following questions.

Is this a test of two means or two proportions?

two means

Are the populations standard deviations known or unknown?

unknown

Which distribution do you use to perform the test?

student's-t

What is the random variable?

X A - X B

What are the null and alternate hypothesis?

  • H o : μ A μ B
  • H a : μ A > μ B

Is this test right, left, or two tailed?

right

What is the p-value?

0.1928

Do you reject or not reject the null hypothesis?

Do not reject.

Conclusion:

At the 1% level of significance, from the sample data, there is not sufficient evidence to conclude that a student who graduates from college A hastaken more math classes, on the average, than a student who graduates from college B.

Questions & Answers

I'm interested in biological psychology and cognitive psychology
Tanya Reply
what does preconceived mean
sammie Reply
physiological Psychology
Nwosu Reply
How can I develope my cognitive domain
Amanyire Reply
why is communication effective
Dakolo Reply
Communication is effective because it allows individuals to share ideas, thoughts, and information with others.
effective communication can lead to improved outcomes in various settings, including personal relationships, business environments, and educational settings. By communicating effectively, individuals can negotiate effectively, solve problems collaboratively, and work towards common goals.
it starts up serve and return practice/assessments.it helps find voice talking therapy also assessments through relaxed conversation.
miss
Every time someone flushes a toilet in the apartment building, the person begins to jumb back automatically after hearing the flush, before the water temperature changes. Identify the types of learning, if it is classical conditioning identify the NS, UCS, CS and CR. If it is operant conditioning, identify the type of consequence positive reinforcement, negative reinforcement or punishment
Wekolamo Reply
please i need answer
Wekolamo
because it helps many people around the world to understand how to interact with other people and understand them well, for example at work (job).
Manix Reply
Agreed 👍 There are many parts of our brains and behaviors, we really need to get to know. Blessings for everyone and happy Sunday!
ARC
A child is a member of community not society elucidate ?
JESSY Reply
Isn't practices worldwide, be it psychology, be it science. isn't much just a false belief of control over something the mind cannot truly comprehend?
Simon Reply
compare and contrast skinner's perspective on personality development on freud
namakula Reply
Skinner skipped the whole unconscious phenomenon and rather emphasized on classical conditioning
war
explain how nature and nurture affect the development and later the productivity of an individual.
Amesalu Reply
nature is an hereditary factor while nurture is an environmental factor which constitute an individual personality. so if an individual's parent has a deviant behavior and was also brought up in an deviant environment, observation of the behavior and the inborn trait we make the individual deviant.
Samuel
I am taking this course because I am hoping that I could somehow learn more about my chosen field of interest and due to the fact that being a PsyD really ignites my passion as an individual the more I hope to learn about developing and literally explore the complexity of my critical thinking skills
Zyryn Reply
good👍
Jonathan
and having a good philosophy of the world is like a sandwich and a peanut butter 👍
Jonathan
generally amnesi how long yrs memory loss
Kelu Reply
interpersonal relationships
Abdulfatai Reply
What would be the best educational aid(s) for gifted kids/savants?
Heidi Reply
treat them normal, if they want help then give them. that will make everyone happy
Saurabh
Got questions? Join the online conversation and get instant answers!
Jobilize.com Reply
Practice Key Terms 3

Get Jobilize Job Search Mobile App in your pocket Now!

Get it on Google Play Download on the App Store Now


Source:  OpenStax, Quantitative information analysis iii. OpenStax CNX. Dec 25, 2009 Download for free at http://cnx.org/content/col11155/1.1
Google Play and the Google Play logo are trademarks of Google Inc.

Notification Switch

Would you like to follow the 'Quantitative information analysis iii' conversation and receive update notifications?

Ask