| << Chapter < Page | Chapter >> Page > |
Populations are dynamic entities. Their size and composition fluctuate in response to numerous factors, including seasonal and yearly changes in the environment, natural disasters such as forest fires and volcanic eruptions, and competition for resources between and within species. The statistical study of populations is called demography : a set of mathematical tools designed to describe populations and investigate how they change. Many of these tools were actually designed to study human populations. For example, life tables , which detail the life expectancy of individuals within a population, were initially developed by life insurance companies to set insurance rates. In fact, while the term “demographics” is sometimes assumed to mean a study of human populations, all living populations can be studied using this approach.
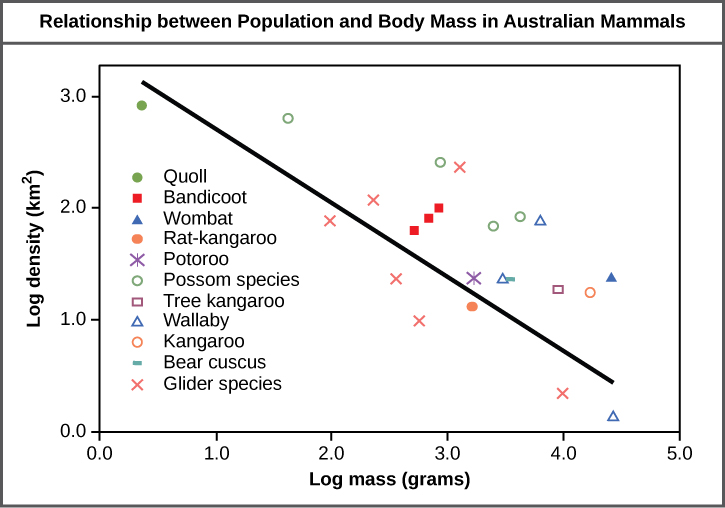
Populations are characterized by their population size (total number of individuals) and their population density (number of individuals per unit area). A population may have a large number of individuals that are distributed densely, or sparsely. There are also populations with small numbers of individuals that may be dense or very sparsely distributed in a local area. Population size can affect potential for adaptation because it affects the amount of genetic variation present in the population. Density can have effects on interactions within a population such as competition for food and the ability of individuals to find a mate. Smaller organisms tend to be more densely distributed than larger organisms ( [link] ).

As this graph shows, population density typically decreases with increasing body size. Why do you think this is the case?
The most accurate way to determine population size is to count all of the individuals within the area. However, this method is usually not logistically or economically feasible, especially when studying large areas. Thus, scientists usually study populations by sampling a representative portion of each habitat and use this sample to make inferences about the population as a whole. The methods used to sample populations to determine their size and density are typically tailored to the characteristics of the organism being studied. For immobile organisms such as plants, or for very small and slow-moving organisms, a quadrat may be used. A quadrat is a wood, plastic, or metal square that is randomly located on the ground and used to count the number of individuals that lie within its boundaries. To obtain an accurate count using this method, the square must be placed at random locations within the habitat enough times to produce an accurate estimate. This counting method will provide an estimate of both population size and density. The number and size of quadrat samples depends on the type of organisms and the nature of their distribution.

Notification Switch
Would you like to follow the 'Concepts in biology (biology 1060 tri-c)' conversation and receive update notifications?